|
Download Data (XLS File) |
|
||||||||
|
||||||||
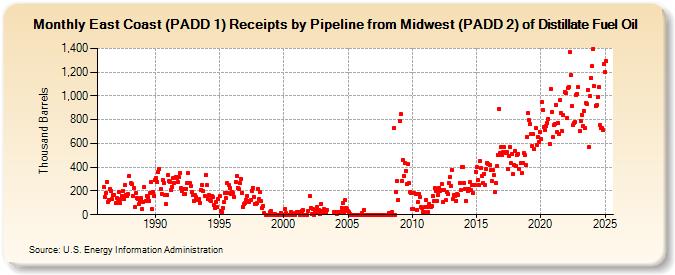
| East Coast (PADD 1) Receipts by Pipeline from Midwest (PADD 2) of Distillate Fuel Oil (Thousand Barrels) | ||||||||
| Year | Jan | Feb | Mar | Apr | May | Jun | Jul | Aug | Sep | Oct | Nov | Dec |
|---|---|---|---|---|---|---|---|---|---|---|---|---|
| 1986 | 231 | 146 | 182 | 278 | 108 | 128 | 217 | 197 | 130 | 168 | 167 | 96 |
| 1987 | 143 | 107 | 193 | 100 | 130 | 161 | 202 | 134 | 252 | 164 | 159 | 171 |
| 1988 | 330 | 264 | 256 | 157 | 223 | 65 | 180 | 144 | 133 | 91 | 114 | 138 |
| 1989 | 48 | 107 | 232 | 116 | 160 | 147 | 115 | 181 | 274 | 45 | 187 | 158 |
| 1990 | 290 | 307 | 276 | 360 | 388 | 217 | 177 | 296 | 270 | 165 | 88 | 165 |
| 1991 | 335 | 285 | 277 | 206 | 235 | 313 | 269 | 321 | 307 | 275 | 315 | 350 |
| 1992 | 222 | 199 | 214 | 174 | 175 | 216 | 271 | 347 | 264 | 241 | 191 | 164 |
| 1993 | 118 | 163 | 147 | 122 | 126 | 133 | 102 | 211 | 251 | 196 | 160 | 338 |
| 1994 | 251 | 130 | 164 | 126 | 113 | 160 | 146 | 82 | 60 | 111 | 61 | 136 |
| 1995 | 157 | 30 | 25 | 58 | 103 | 186 | 142 | 264 | 181 | 247 | 226 | 172 |
| 1996 | 188 | 179 | 153 | 276 | 327 | 225 | 216 | 263 | 303 | 185 | 63 | 86 |
| 1997 | 100 | 128 | 157 | 113 | 109 | 124 | 202 | 228 | 152 | 93 | 88 | 95 |
| 1998 | 217 | 132 | 188 | 113 | 55 | 74 | 13 | 0 | 0 | 0 | 0 | 19 |
| 1999 | 29 | 9 | 1 | 0 | 4 | 1 | 0 | 0 | 1 | 17 | 0 | 0 |
| 2000 | 0 | 44 | 13 | 0 | 0 | 0 | 0 | 24 | 14 | 0 | 0 | 12 |
| 2001 | 21 | 11 | 20 | 0 | 9 | 28 | 39 | 0 | 0 | 0 | 0 | 34 |
| 2002 | 156 | 58 | 5 | 49 | 0 | 20 | 34 | 64 | 18 | 40 | 5 | 94 |
| 2003 | 30 | 17 | 44 | 18 | 43 | 20 | ||||||
| 2004 | 24 | 10 | 20 | 20 | 20 | 60 | 98 | 20 | 120 | 59 | 49 | |
| 2005 | 30 | 20 | 10 | 0 | 0 | 0 | 0 | 0 | 0 | 0 | 0 | 0 |
| 2006 | 0 | 18 | 1 | 43 | 0 | 0 | 0 | 0 | 0 | 0 | 0 | 0 |
| 2007 | 0 | 0 | 0 | 0 | 0 | 0 | 0 | 0 | 0 | 0 | 0 | 0 |
| 2008 | 0 | 0 | 14 | 0 | 0 | 24 | 0 | 730 | 0 | 195 | 284 | 128 |
| 2009 | 790 | 845 | 283 | 461 | 326 | 435 | 369 | 255 | 424 | 263 | 193 | 185 |
| 2010 | 48 | 52 | 180 | 175 | 43 | 106 | 178 | 150 | 61 | 58 | 20 | 23 |
| 2011 | 64 | 126 | 63 | 19 | 94 | 66 | 75 | 156 | 116 | 222 | 203 | 118 |
| 2012 | 168 | 228 | 200 | 210 | 256 | 109 | 207 | 121 | 191 | 174 | 267 | 317 |
| 2013 | 242 | 378 | 136 | 163 | 159 | 118 | 172 | 168 | 268 | 210 | 401 | 403 |
| 2014 | 270 | 215 | 117 | 217 | 202 | 213 | 274 | 205 | 246 | 179 | 248 | 362 |
| 2015 | 398 | 293 | 251 | 451 | 393 | 324 | 266 | 343 | 250 | 386 | 438 | 429 |
| 2016 | 422 | 374 | 285 | 375 | 335 | 193 | 263 | 412 | 504 | 892 | 517 | 573 |
| 2017 | 503 | 530 | 567 | 523 | 531 | 383 | 498 | 566 | 435 | 512 | 344 | 421 |
| 2018 | 539 | 409 | 502 | 514 | 384 | 432 | 351 | 434 | 519 | 499 | 415 | 657 |
| 2019 | 854 | 794 | 763 | 677 | 575 | 679 | 552 | 734 | 588 | 656 | 608 | 698 |
| 2020 | 636 | 949 | 882 | 741 | 709 | 744 | 775 | 808 | 596 | 1,062 | 864 | 650 |
| 2021 | 753 | 763 | 924 | 695 | 776 | 678 | 964 | 855 | 702 | 839 | 1,031 | 1,022 |
| 2022 | 815 | 1,063 | 1,075 | 1,368 | 1,174 | 913 | 752 | 772 | 780 | 1,010 | 1,016 | 1,071 |
| 2023 | 704 | 793 | 842 | 745 | 877 | 727 | 942 | 930 | 1,050 | 1,248 | 998 | 1,154 |
| 2024 | 1,251 | |||||||||||
| - = No Data Reported; -- = Not Applicable; NA = Not Available; W = Withheld to avoid disclosure of individual company data. |
| Release Date: 3/29/2024 |
| Next Release Date: 4/30/2024 |