|
Download Data (XLS File) |
|
||||||||
|
||||||||
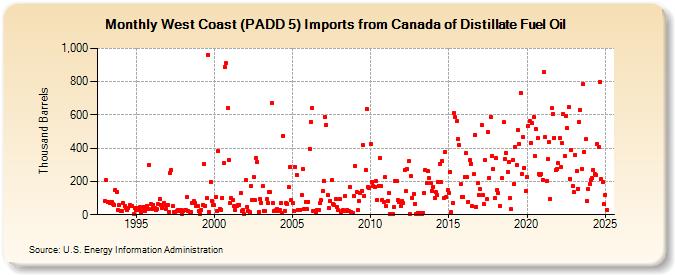
| West Coast (PADD 5) Imports from Canada of Distillate Fuel Oil (Thousand Barrels) | ||||||||
| Year | Jan | Feb | Mar | Apr | May | Jun | Jul | Aug | Sep | Oct | Nov | Dec |
|---|---|---|---|---|---|---|---|---|---|---|---|---|
| 1993 | 81 | 206 | 77 | 75 | 73 | 77 | 65 | 61 | 148 | 134 | 27 | 56 |
| 1994 | 20 | 22 | 72 | 55 | 42 | 29 | 39 | 58 | 50 | 55 | 2 | 40 |
| 1995 | 27 | 38 | 27 | 44 | 13 | 24 | 49 | 25 | 54 | 37 | 299 | 63 |
| 1996 | 32 | 61 | 39 | 28 | 32 | 62 | 93 | 58 | 41 | 69 | 58 | 34 |
| 1997 | 58 | 19 | 250 | 268 | 52 | 18 | 17 | 22 | 31 | 20 | 28 | 3 |
| 1998 | 22 | 26 | 31 | 104 | 22 | 18 | 15 | 72 | 80 | 70 | 54 | 53 |
| 1999 | 20 | 5 | 30 | 60 | 305 | 54 | 99 | 963 | 17 | 198 | 83 | 58 |
| 2000 | 56 | 105 | 24 | 384 | 36 | 29 | 103 | 309 | 887 | 910 | 640 | 330 |
| 2001 | 69 | 100 | 86 | 51 | 26 | 50 | 61 | 61 | 131 | 22 | 30 | 2 |
| 2002 | 206 | 49 | 22 | 17 | 172 | 91 | 227 | 87 | 341 | 316 | 18 | 95 |
| 2003 | 73 | 171 | 23 | 22 | 92 | 70 | 136 | 135 | 669 | 70 | 25 | 26 |
| 2004 | 36 | 25 | 27 | 73 | 13 | 476 | 23 | 69 | 65 | 166 | 286 | 86 |
| 2005 | 68 | 25 | 287 | 241 | 31 | 26 | 30 | 120 | 272 | 32 | 79 | 34 |
| 2006 | 79 | 397 | 559 | 643 | 22 | 22 | 8 | 29 | 27 | 70 | 86 | 142 |
| 2007 | 203 | 585 | 538 | 117 | 41 | 84 | 207 | 63 | 57 | 93 | 44 | 26 |
| 2008 | 95 | 15 | 20 | 27 | 114 | 22 | 30 | 22 | 167 | 16 | 11 | 113 |
| 2009 | 291 | 137 | 28 | 81 | 133 | 144 | 418 | 115 | 269 | 638 | 167 | 163 |
| 2010 | 426 | 194 | 174 | 167 | 200 | 88 | 174 | 343 | 172 | 86 | 78 | 225 |
| 2011 | 52 | 85 | 131 | 3 | 3 | 3 | 46 | 200 | 204 | 86 | 79 | 52 |
| 2012 | 85 | 72 | 270 | 141 | 274 | 321 | 5 | 231 | 102 | 127 | 66 | 7 |
| 2013 | 13 | 7 | 9 | 5 | 12 | 130 | 266 | 189 | 260 | 220 | 190 | 145 |
| 2014 | 167 | 99 | 135 | 116 | 195 | 305 | 195 | 324 | 99 | 379 | 105 | 146 |
| 2015 | 133 | 254 | 17 | 73 | 611 | 585 | 561 | 456 | 419 | 183 | 108 | 109 |
| 2016 | 228 | 370 | 225 | 79 | 326 | 306 | 50 | 242 | 480 | 47 | 188 | 117 |
| 2017 | 154 | 538 | 121 | 63 | 328 | 92 | 497 | 222 | 586 | 353 | 275 | 99 |
| 2018 | 338 | 150 | 132 | 54 | 220 | 557 | 335 | 373 | 259 | 315 | 100 | |
| 2019 | 32 | 331 | 186 | 408 | 299 | 510 | 425 | 732 | 247 | 468 | 283 | 143 |
| 2020 | 227 | 536 | 563 | 432 | 551 | 585 | 353 | 515 | 459 | 246 | 241 | 242 |
| 2021 | 211 | 856 | 467 | 201 | 332 | 437 | 95 | 639 | 606 | 464 | 268 | 277 |
| 2022 | 308 | 460 | 288 | 430 | 607 | 352 | 594 | 520 | 646 | 217 | 388 | 171 |
| 2023 | 134 | 361 | 261 | 157 | 558 | 631 | 277 | 783 | 379 | 453 | 79 | 156 |
| 2024 | 182 | |||||||||||
| - = No Data Reported; -- = Not Applicable; NA = Not Available; W = Withheld to avoid disclosure of individual company data. |
| Release Date: 3/29/2024 |
| Next Release Date: 4/30/2024 |