|
Download Data (XLS File) |
|
||||||||
|
||||||||
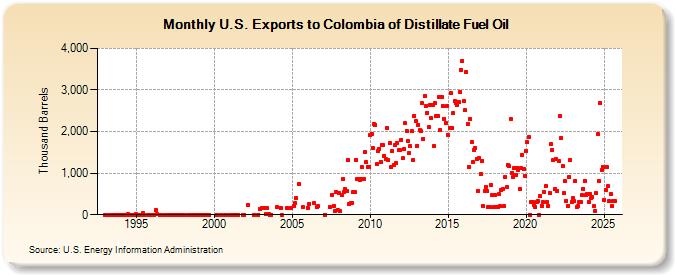
| U.S. Exports to Colombia of Distillate Fuel Oil (Thousand Barrels) | ||||||||
| Year | Jan | Feb | Mar | Apr | May | Jun | Jul | Aug | Sep | Oct | Nov | Dec |
|---|---|---|---|---|---|---|---|---|---|---|---|---|
| 1993 | 4 | 0 | 0 | 4 | 1 | 0 | 0 | 0 | 3 | |||
| 1994 | 0 | 1 | 3 | 0 | 8 | 4 | 2 | 0 | 0 | 4 | ||
| 1995 | 20 | 2 | 4 | 1 | 0 | 30 | 4 | 0 | 3 | 4 | ||
| 1996 | 0 | 0 | 118 | 8 | 0 | 1 | 0 | |||||
| 1997 | 0 | 1 | 0 | 0 | 1 | 0 | 0 | 0 | 0 | 5 | 0 | |
| 1998 | 1 | 1 | 0 | 0 | 0 | 1 | 1 | 0 | ||||
| 1999 | 0 | 0 | 0 | 4 | 1 | |||||||
| 2000 | 0 | 0 | 1 | 0 | ||||||||
| 2001 | 0 | 0 | 0 | 0 | 0 | 0 | 0 | |||||
| 2002 | 241 | 0 | 0 | 140 | ||||||||
| 2003 | 161 | 152 | 9 | 160 | 9 | 4 | 1 | |||||
| 2004 | 182 | 170 | 0 | 170 | 170 | |||||||
| 2005 | 205 | 275 | 404 | 735 | 175 | |||||||
| 2006 | 170 | 260 | 275 | 175 | 204 | |||||||
| 2007 | 0 | 190 | 481 | 210 | 80 | 558 | 120 | |||||
| 2008 | 522 | 80 | 478 | 859 | 553 | 610 | 566 | 1,310 | 268 | 280 | 284 | 543 |
| 2009 | 545 | 1,326 | 848 | 849 | 836 | 853 | 1,141 | 852 | 1,505 | 1,261 | 1,153 | 1,146 |
| 2010 | 1,912 | 1,943 | 1,609 | 2,180 | 2,160 | 1,220 | 1,542 | 1,589 | 1,269 | 1,685 | 1,670 | 1,408 |
| 2011 | 1,329 | 2,085 | 1,306 | 1,728 | 1,147 | 1,525 | 1,200 | 1,667 | 1,244 | 1,723 | 1,547 | 1,552 |
| 2012 | 1,800 | 1,358 | 1,579 | 2,197 | 2,024 | 1,782 | 1,487 | 1,647 | 2,003 | 1,318 | 2,371 | 2,251 |
| 2013 | 1,660 | 2,163 | 2,030 | 2,005 | 2,675 | 1,826 | 2,856 | 2,616 | 2,455 | 2,100 | 2,649 | 2,315 |
| 2014 | 2,638 | 1,649 | 2,676 | 2,380 | 2,365 | 2,831 | 2,027 | 2,822 | 2,612 | 2,309 | 2,209 | 2,612 |
| 2015 | 1,918 | 2,076 | 2,929 | 2,088 | 2,439 | 2,736 | 2,685 | 2,635 | 2,717 | 2,950 | 3,475 | 3,696 |
| 2016 | 2,736 | 2,511 | 3,433 | 2,181 | 1,150 | 2,301 | 1,739 | 1,256 | 1,553 | 1,606 | 1,348 | 579 |
| 2017 | 1,360 | 982 | 1,299 | 207 | 579 | 670 | 563 | 182 | 181 | 724 | 465 | 176 |
| 2018 | 470 | 181 | 180 | 487 | 198 | 591 | 615 | 200 | 905 | 664 | 1,204 | 1,170 |
| 2019 | 2,307 | 1,012 | 899 | 1,124 | 959 | 1,132 | 1,084 | 627 | 1,120 | 1,448 | 1,103 | 941 |
| 2020 | 1,534 | 1,739 | 1,865 | 1 | 300 | 314 | 231 | 188 | 308 | 330 | 0 | 452 |
| 2021 | 216 | 297 | 542 | 682 | 301 | 219 | 524 | 1,694 | 1,564 | 1,311 | 612 | 1,332 |
| 2022 | 580 | 1,303 | 2,369 | 1,839 | 1,167 | 517 | 808 | 331 | 206 | 906 | 1,325 | 296 |
| 2023 | 206 | 328 | 814 | 220 | 2 | 302 | 301 | 470 | 629 | 815 | 278 | 302 |
| 2024 | 503 | |||||||||||
| - = No Data Reported; -- = Not Applicable; NA = Not Available; W = Withheld to avoid disclosure of individual company data. |
| Release Date: 3/29/2024 |
| Next Release Date: 4/30/2024 |