|
Download Data (XLS File) |
|
||||||||
|
||||||||
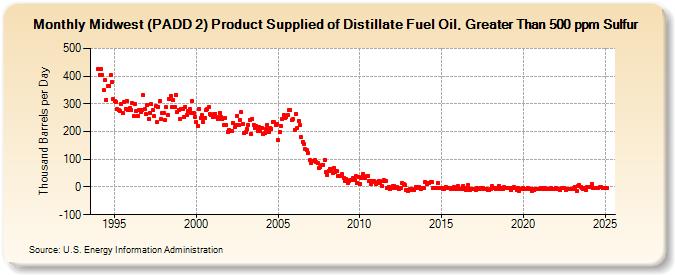
| Midwest (PADD 2) Product Supplied of Distillate Fuel Oil, Greater Than 500 ppm Sulfur (Thousand Barrels per Day) | ||||||||
| Year | Jan | Feb | Mar | Apr | May | Jun | Jul | Aug | Sep | Oct | Nov | Dec |
|---|---|---|---|---|---|---|---|---|---|---|---|---|
| 1994 | 427 | 405 | 424 | 404 | 349 | 386 | 313 | 364 | 365 | 404 | 380 | 317 |
| 1995 | 311 | 308 | 283 | 276 | 274 | 301 | 267 | 308 | 283 | 309 | 278 | 284 |
| 1996 | 278 | 302 | 256 | 300 | 274 | 257 | 276 | 270 | 278 | 331 | 281 | 262 |
| 1997 | 296 | 246 | 267 | 298 | 276 | 255 | 292 | 233 | 290 | 309 | 244 | 266 |
| 1998 | 267 | 240 | 287 | 258 | 317 | 330 | 290 | 314 | 289 | 332 | 271 | 279 |
| 1999 | 246 | 283 | 283 | 252 | 289 | 259 | 275 | 280 | 268 | 310 | 266 | 254 |
| 2000 | 233 | 221 | 281 | 248 | 258 | 235 | 250 | 276 | 280 | 288 | 262 | 260 |
| 2001 | 252 | 262 | 265 | 253 | 245 | 268 | 253 | 244 | 224 | 250 | 222 | 200 |
| 2002 | 206 | 203 | 202 | 231 | 215 | 225 | 257 | 222 | 243 | 269 | 229 | 194 |
| 2003 | 197 | 209 | 225 | 241 | 192 | 247 | 224 | 212 | 220 | 202 | 215 | 202 |
| 2004 | 213 | 191 | 193 | 210 | 224 | 198 | 213 | 211 | 235 | 234 | 225 | 227 |
| 2005 | 169 | 199 | 221 | 247 | 260 | 250 | 253 | 260 | 277 | 276 | 241 | 246 |
| 2006 | 207 | 264 | 214 | 239 | 223 | 179 | 163 | 154 | 137 | 132 | 123 | 96 |
| 2007 | 85 | 93 | 93 | 98 | 90 | 85 | 69 | 72 | 79 | 81 | 97 | 54 |
| 2008 | 45 | 59 | 65 | 65 | 52 | 70 | 55 | 58 | 38 | 38 | 38 | 46 |
| 2009 | 32 | 21 | 28 | 15 | 21 | 24 | 24 | 31 | 27 | 38 | 16 | 37 |
| 2010 | 9 | 32 | 46 | 34 | 31 | 38 | 39 | 20 | 11 | 20 | 23 | 19 |
| 2011 | 12 | 13 | 21 | 14 | 5 | 20 | 24 | 21 | -3 | 0 | -7 | -3 |
| 2012 | 3 | 4 | -2 | 0 | -3 | -9 | -3 | 13 | 11 | 7 | -11 | -13 |
| 2013 | -12 | -6 | -6 | -12 | -11 | 1 | -4 | 0 | -2 | -7 | -5 | -2 |
| 2014 | 17 | 12 | 16 | 16 | 18 | 18 | -4 | -4 | -2 | 14 | -3 | -5 |
| 2015 | -5 | -6 | -7 | 0 | -2 | -2 | -4 | -9 | -5 | 0 | -8 | -2 |
| 2016 | 3 | -7 | -6 | -9 | 4 | -2 | -10 | 6 | -6 | -10 | -6 | -7 |
| 2017 | -6 | -11 | -4 | -6 | -6 | -3 | -5 | -7 | -8 | -9 | -10 | -12 |
| 2018 | -6 | 2 | -2 | -3 | -6 | -6 | 5 | -6 | -5 | -7 | -1 | -3 |
| 2019 | -5 | -5 | -2 | -10 | -2 | -1 | -5 | -10 | -5 | -13 | -6 | -9 |
| 2020 | -3 | -7 | -8 | -3 | -7 | -7 | -13 | -8 | -12 | -9 | -7 | -6 |
| 2021 | -6 | -4 | -5 | -9 | -4 | -6 | -8 | -6 | -5 | -9 | -9 | -6 |
| 2022 | -4 | -7 | -9 | -11 | -5 | -5 | -3 | -10 | -9 | -6 | -8 | -7 |
| 2023 | -9 | -4 | 1 | -14 | 2 | 6 | -1 | -6 | -9 | -4 | -12 | -1 |
| 2024 | 1 | |||||||||||
| - = No Data Reported; -- = Not Applicable; NA = Not Available; W = Withheld to avoid disclosure of individual company data. |
| Release Date: 3/29/2024 |
| Next Release Date: 4/30/2024 |