|
Download Data (XLS File) |
|
||||||||
|
||||||||
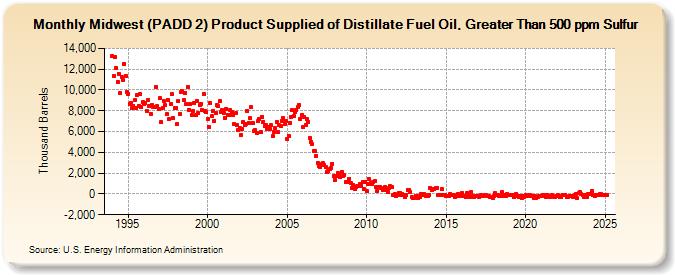
| Midwest (PADD 2) Product Supplied of Distillate Fuel Oil, Greater Than 500 ppm Sulfur (Thousand Barrels) | ||||||||
| Year | Jan | Feb | Mar | Apr | May | Jun | Jul | Aug | Sep | Oct | Nov | Dec |
|---|---|---|---|---|---|---|---|---|---|---|---|---|
| 1994 | 13,226 | 11,344 | 13,141 | 12,125 | 10,805 | 11,580 | 9,700 | 11,292 | 10,944 | 12,518 | 11,389 | 9,821 |
| 1995 | 9,646 | 8,630 | 8,764 | 8,265 | 8,504 | 9,025 | 8,277 | 9,557 | 8,476 | 9,579 | 8,355 | 8,807 |
| 1996 | 8,603 | 8,754 | 7,947 | 8,993 | 8,485 | 7,720 | 8,559 | 8,366 | 8,331 | 10,267 | 8,416 | 8,126 |
| 1997 | 9,189 | 6,893 | 8,285 | 8,935 | 8,554 | 7,645 | 9,038 | 7,219 | 8,687 | 9,578 | 7,318 | 8,251 |
| 1998 | 8,291 | 6,719 | 8,907 | 7,726 | 9,842 | 9,897 | 8,988 | 9,738 | 8,666 | 10,303 | 8,120 | 8,644 |
| 1999 | 7,625 | 7,935 | 8,772 | 7,547 | 8,951 | 7,780 | 8,516 | 8,694 | 8,054 | 9,595 | 7,989 | 7,867 |
| 2000 | 7,235 | 6,406 | 8,720 | 7,449 | 7,989 | 7,041 | 7,763 | 8,556 | 8,414 | 8,917 | 7,849 | 8,067 |
| 2001 | 7,804 | 7,343 | 8,213 | 7,584 | 7,591 | 8,052 | 7,857 | 7,553 | 6,722 | 7,755 | 6,656 | 6,197 |
| 2002 | 6,382 | 5,677 | 6,254 | 6,930 | 6,670 | 6,745 | 7,974 | 6,868 | 7,289 | 8,334 | 6,863 | 6,014 |
| 2003 | 6,107 | 5,857 | 6,986 | 7,232 | 5,953 | 7,408 | 6,932 | 6,564 | 6,588 | 6,264 | 6,440 | 6,252 |
| 2004 | 6,596 | 5,526 | 5,983 | 6,294 | 6,940 | 5,937 | 6,591 | 6,529 | 7,050 | 7,269 | 6,748 | 7,039 |
| 2005 | 5,239 | 5,581 | 6,865 | 7,410 | 8,055 | 7,490 | 7,856 | 8,056 | 8,315 | 8,570 | 7,240 | 7,639 |
| 2006 | 6,409 | 7,380 | 6,626 | 7,173 | 6,917 | 5,374 | 5,042 | 4,775 | 4,120 | 4,101 | 3,692 | 2,963 |
| 2007 | 2,643 | 2,591 | 2,884 | 2,953 | 2,799 | 2,546 | 2,129 | 2,223 | 2,366 | 2,517 | 2,905 | 1,682 |
| 2008 | 1,380 | 1,701 | 2,026 | 1,961 | 1,614 | 2,104 | 1,709 | 1,812 | 1,127 | 1,164 | 1,144 | 1,433 |
| 2009 | 1,003 | 596 | 874 | 451 | 658 | 729 | 756 | 971 | 806 | 1,174 | 480 | 1,162 |
| 2010 | 278 | 909 | 1,420 | 1,032 | 974 | 1,153 | 1,202 | 629 | 327 | 628 | 684 | 586 |
| 2011 | 387 | 352 | 645 | 410 | 153 | 588 | 735 | 656 | -81 | 6 | -212 | -86 |
| 2012 | 94 | 107 | -61 | 6 | -105 | -262 | -84 | 407 | 335 | 205 | -321 | -415 |
| 2013 | -361 | -155 | -184 | -363 | -333 | 37 | -111 | 7 | -56 | -204 | -159 | -67 |
| 2014 | 533 | 331 | 503 | 469 | 566 | 545 | -109 | -129 | -72 | 427 | -100 | -146 |
| 2015 | -169 | -167 | -202 | 14 | -76 | -70 | -116 | -282 | -161 | 6 | -237 | -75 |
| 2016 | 101 | -208 | -201 | -271 | 119 | -45 | -311 | 201 | -194 | -313 | -181 | -230 |
| 2017 | -194 | -307 | -124 | -165 | -176 | -95 | -147 | -204 | -246 | -272 | -304 | -357 |
| 2018 | -193 | 44 | -74 | -87 | -183 | -173 | 158 | -196 | -146 | -228 | -36 | -106 |
| 2019 | -151 | -148 | -66 | -300 | -69 | -22 | -165 | -312 | -153 | -413 | -181 | -294 |
| 2020 | -81 | -210 | -247 | -98 | -213 | -219 | -388 | -240 | -350 | -279 | -199 | -180 |
| 2021 | -187 | -107 | -150 | -260 | -128 | -166 | -256 | -183 | -140 | -267 | -274 | -186 |
| 2022 | -123 | -195 | -283 | -326 | -143 | -141 | -83 | -305 | -271 | -191 | -226 | -217 |
| 2023 | -267 | -108 | 22 | -412 | 50 | 189 | -41 | -171 | -262 | -128 | -345 | -31 |
| 2024 | 33 | |||||||||||
| - = No Data Reported; -- = Not Applicable; NA = Not Available; W = Withheld to avoid disclosure of individual company data. |
| Release Date: 3/29/2024 |
| Next Release Date: 4/30/2024 |