|
Download Data (XLS File) |
|
||||||||
|
||||||||
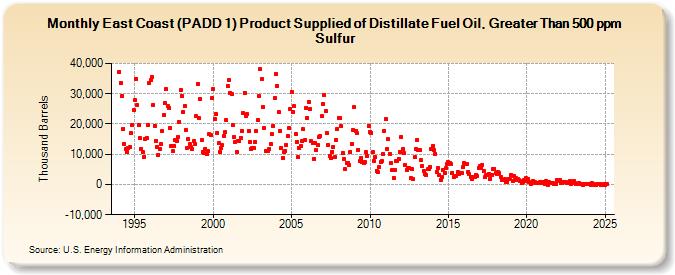
| East Coast (PADD 1) Product Supplied of Distillate Fuel Oil, Greater Than 500 ppm Sulfur (Thousand Barrels) | ||||||||
| Year | Jan | Feb | Mar | Apr | May | Jun | Jul | Aug | Sep | Oct | Nov | Dec |
|---|---|---|---|---|---|---|---|---|---|---|---|---|
| 1994 | 37,344 | 33,492 | 29,188 | 18,373 | 13,421 | 11,582 | 10,769 | 12,058 | 12,383 | 16,853 | 19,712 | 24,633 |
| 1995 | 27,849 | 34,929 | 26,217 | 19,507 | 15,268 | 11,854 | 10,711 | 9,167 | 15,122 | 15,373 | 19,794 | 33,599 |
| 1996 | 34,516 | 35,505 | 26,358 | 19,490 | 14,340 | 12,488 | 9,840 | 11,875 | 13,342 | 17,692 | 23,016 | 26,859 |
| 1997 | 31,461 | 25,971 | 25,391 | 18,576 | 12,779 | 10,926 | 12,725 | 14,686 | 14,238 | 15,613 | 20,676 | 31,107 |
| 1998 | 29,293 | 23,995 | 25,864 | 18,089 | 12,143 | 15,011 | 13,290 | 12,250 | 11,788 | 14,277 | 13,447 | 22,525 |
| 1999 | 33,373 | 21,871 | 28,211 | 14,592 | 10,851 | 10,341 | 11,832 | 10,036 | 10,918 | 16,574 | 16,223 | 28,480 |
| 2000 | 31,543 | 21,558 | 23,155 | 16,946 | 13,612 | 10,739 | 12,179 | 12,890 | 16,028 | 17,220 | 21,310 | 32,562 |
| 2001 | 34,490 | 30,310 | 30,013 | 19,601 | 15,775 | 14,147 | 10,789 | 14,529 | 14,310 | 15,485 | 17,824 | 23,628 |
| 2002 | 30,262 | 22,595 | 23,243 | 17,791 | 14,193 | 11,794 | 11,951 | 11,908 | 14,176 | 17,532 | 21,348 | 29,130 |
| 2003 | 38,134 | 34,796 | 25,573 | 18,809 | 11,183 | 10,945 | 11,125 | 11,670 | 13,397 | 16,640 | 19,357 | 28,662 |
| 2004 | 36,510 | 32,545 | 23,950 | 17,839 | 12,185 | 8,779 | 10,622 | 10,969 | 13,067 | 15,950 | 18,521 | 25,021 |
| 2005 | 30,451 | 23,888 | 25,855 | 16,749 | 14,123 | 9,046 | 12,002 | 12,654 | 14,250 | 18,226 | 14,605 | 25,419 |
| 2006 | 22,086 | 27,366 | 24,975 | 14,220 | 13,696 | 8,575 | 13,641 | 11,286 | 13,075 | 15,634 | 15,993 | 22,559 |
| 2007 | 26,649 | 29,652 | 24,156 | 16,958 | 13,072 | 9,573 | 8,596 | 10,750 | 12,492 | 9,122 | 14,827 | 18,281 |
| 2008 | 21,943 | 21,882 | 19,347 | 10,425 | 8,327 | 4,994 | 7,001 | 7,056 | 6,497 | 10,768 | 13,484 | 18,037 |
| 2009 | 25,509 | 17,744 | 16,926 | 11,526 | 7,642 | 8,655 | 7,386 | 7,183 | 7,488 | 10,647 | 9,468 | 19,450 |
| 2010 | 17,408 | 17,066 | 10,586 | 7,694 | 8,961 | 4,546 | 4,060 | 5,735 | 7,487 | 7,744 | 10,221 | 17,724 |
| 2011 | 21,564 | 11,737 | 14,868 | 10,202 | 7,072 | 4,673 | 2,259 | 4,847 | 7,862 | 7,692 | 8,504 | 10,717 |
| 2012 | 15,777 | 11,691 | 10,302 | 6,304 | 4,731 | 5,471 | 5,556 | 1,996 | 5,029 | 1,766 | 8,970 | 11,771 |
| 2013 | 14,749 | 11,450 | 11,331 | 7,965 | 6,066 | 4,461 | 3,525 | 3,047 | 5,000 | 5,165 | 5,781 | 11,733 |
| 2014 | 12,877 | 11,244 | 10,117 | 4,248 | 5,474 | 3,017 | 1,543 | 2,333 | 4,877 | 3,716 | 5,357 | 6,754 |
| 2015 | 7,370 | 7,133 | 6,805 | 3,945 | 2,344 | 2,785 | 2,802 | 4,099 | 3,345 | 3,717 | 3,730 | 5,717 |
| 2016 | 7,166 | 6,807 | 6,663 | 4,217 | 3,392 | 2,507 | 1,829 | 2,525 | 2,460 | 3,249 | 2,707 | 5,475 |
| 2017 | 6,110 | 5,465 | 6,493 | 4,391 | 2,335 | 3,210 | 3,040 | 3,483 | 1,929 | 3,239 | 5,206 | 5,251 |
| 2018 | 3,768 | 3,550 | 4,251 | 3,641 | 2,545 | 1,317 | 1,487 | 1,668 | 784 | 837 | 1,836 | 1,947 |
| 2019 | 3,214 | 1,189 | 2,911 | 1,399 | 2,044 | 1,712 | 1,315 | 1,045 | 439 | 677 | 1,462 | 2,075 |
| 2020 | 1,127 | 1,838 | 832 | 86 | 592 | 1,080 | 826 | 352 | 414 | 556 | 827 | 971 |
| 2021 | 553 | 784 | -4 | 1,257 | -189 | 773 | 393 | 628 | 420 | 53 | 181 | 1,587 |
| 2022 | 1,184 | 1,483 | 511 | 353 | 860 | 737 | 687 | 431 | 493 | 1,071 | 249 | 788 |
| 2023 | 950 | 563 | 273 | 73 | 509 | 250 | 157 | -445 | 268 | -132 | 451 | 98 |
| 2024 | 261 | |||||||||||
| - = No Data Reported; -- = Not Applicable; NA = Not Available; W = Withheld to avoid disclosure of individual company data. |
| Release Date: 3/29/2024 |
| Next Release Date: 4/30/2024 |