|
Download Data (XLS File) |
|
||||||||
|
||||||||
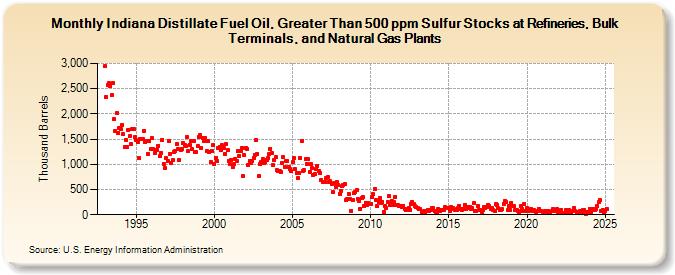
| Indiana Distillate Fuel Oil, Greater Than 500 ppm Sulfur Stocks at Refineries, Bulk Terminals, and Natural Gas Plants (Thousand Barrels) | ||||||||
| Year | Jan | Feb | Mar | Apr | May | Jun | Jul | Aug | Sep | Oct | Nov | Dec |
|---|---|---|---|---|---|---|---|---|---|---|---|---|
| 1993 | 2,945 | 2,335 | 2,564 | 2,605 | 2,544 | 2,369 | 2,603 | 1,896 | 1,660 | 2,010 | 1,630 | 1,730 |
| 1994 | 1,698 | 1,778 | 1,596 | 1,339 | 1,485 | 1,350 | 1,687 | 1,556 | 1,397 | 1,697 | 1,693 | 1,538 |
| 1995 | 1,473 | 1,450 | 1,132 | 1,504 | 1,499 | 1,502 | 1,669 | 1,445 | 1,466 | 1,212 | 1,454 | 1,298 |
| 1996 | 1,514 | 1,295 | 1,228 | 1,274 | 1,288 | 1,371 | 1,159 | 1,228 | 1,489 | 1,012 | 925 | 1,118 |
| 1997 | 1,057 | 1,466 | 1,214 | 1,033 | 1,080 | 1,253 | 1,260 | 1,397 | 1,307 | 1,087 | 1,279 | 1,308 |
| 1998 | 1,419 | 1,379 | 1,366 | 1,543 | 1,258 | 1,385 | 1,472 | 1,302 | 1,455 | 1,249 | 1,236 | 1,355 |
| 1999 | 1,541 | 1,581 | 1,321 | 1,517 | 1,472 | 1,518 | 1,259 | 1,457 | 1,253 | 1,041 | 1,260 | 1,375 |
| 2000 | 1,000 | 1,134 | 1,063 | 1,328 | 1,340 | 1,280 | 1,377 | 1,326 | 1,210 | 1,400 | 1,274 | 1,073 |
| 2001 | 1,001 | 1,088 | 938 | 1,000 | 1,114 | 1,070 | 1,259 | 1,174 | 1,267 | 1,323 | 761 | 1,188 |
| 2002 | 1,332 | 1,301 | 986 | 1,069 | 1,017 | 1,073 | 1,126 | 1,190 | 1,473 | 1,211 | 771 | 1,005 |
| 2003 | 1,055 | 1,103 | 1,024 | 1,053 | 1,095 | 1,132 | 1,199 | 1,310 | 1,220 | 988 | 1,090 | 1,135 |
| 2004 | 879 | 869 | 859 | 838 | 1,035 | 1,142 | 955 | 1,072 | 1,063 | 952 | 903 | 860 |
| 2005 | 1,037 | 1,121 | 901 | 826 | 725 | 833 | 1,127 | 1,464 | 869 | 880 | 1,101 | 1,013 |
| 2006 | 1,098 | 853 | 1,012 | 920 | 790 | 806 | 900 | 975 | 876 | 821 | 690 | 658 |
| 2007 | 653 | 650 | 738 | 746 | 641 | 662 | 613 | 449 | 622 | 551 | 651 | 597 |
| 2008 | 418 | 465 | 561 | 582 | 604 | 301 | 311 | 414 | 309 | 82 | 283 | 421 |
| 2009 | 456 | 482 | 311 | 263 | 120 | 328 | 356 | 177 | 240 | 190 | 224 | 213 |
| 2010 | 221 | 348 | 404 | 505 | 292 | 167 | 257 | 330 | 232 | 257 | 63 | 172 |
| 2011 | 130 | 252 | 364 | 195 | 273 | 183 | 243 | 357 | 184 | 188 | 179 | 163 |
| 2012 | 156 | 180 | 117 | 96 | 116 | 134 | 101 | 208 | 255 | 204 | 164 | 147 |
| 2013 | 137 | 104 | 110 | 50 | 54 | 79 | 53 | 72 | 101 | 80 | 89 | 128 |
| 2014 | 124 | 68 | 54 | 60 | 115 | 66 | 85 | 99 | 91 | 145 | 143 | 141 |
| 2015 | 131 | 75 | 157 | 142 | 109 | 102 | 87 | 137 | 178 | 117 | 89 | 114 |
| 2016 | 202 | 108 | 156 | 140 | 153 | 113 | 130 | 227 | 66 | 72 | 170 | 97 |
| 2017 | 90 | 51 | 95 | 149 | 130 | 151 | 188 | 168 | 110 | 136 | 94 | 81 |
| 2018 | 206 | 191 | 133 | 95 | 99 | 108 | 218 | 275 | 250 | 92 | 168 | 95 |
| 2019 | 241 | 177 | 166 | 95 | 95 | 70 | 62 | 163 | 114 | 76 | 214 | 68 |
| 2020 | 138 | 79 | 109 | 118 | 78 | 99 | 77 | 63 | 68 | 120 | 76 | 73 |
| 2021 | 59 | 44 | 66 | 58 | 71 | 51 | 46 | 67 | 105 | 103 | 66 | 110 |
| 2022 | 51 | 69 | 95 | 27 | 32 | 33 | 86 | 34 | 95 | 34 | 33 | 66 |
| 2023 | 138 | 65 | 53 | 57 | 59 | 76 | 36 | 84 | 94 | 24 | 52 | 28 |
| 2024 | 119 | 63 | 108 | 109 | ||||||||
| - = No Data Reported; -- = Not Applicable; NA = Not Available; W = Withheld to avoid disclosure of individual company data. |
| Release Date: 6/28/2024 |
| Next Release Date: 7/31/2024 |