|
Download Data (XLS File) |
|
||||||||
|
||||||||
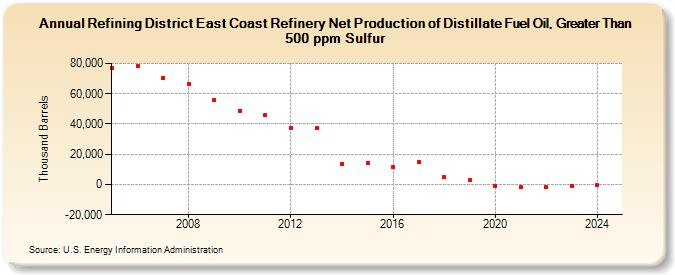
| Refining District East Coast Refinery Net Production of Distillate Fuel Oil, Greater Than 500 ppm Sulfur (Thousand Barrels) | ||||||||
| Decade | Year-0 | Year-1 | Year-2 | Year-3 | Year-4 | Year-5 | Year-6 | Year-7 | Year-8 | Year-9 |
|---|---|---|---|---|---|---|---|---|---|---|
| 2000's | 76,869 | 78,396 | 70,182 | 66,609 | 55,577 | |||||
| 2010's | 48,782 | 45,947 | 37,580 | 37,156 | 13,715 | 14,504 | 11,465 | 15,172 | 4,786 | 2,746 |
| 2020's | -869 | -1,967 | -1,664 | -836 |
| - = No Data Reported; -- = Not Applicable; NA = Not Available; W = Withheld to avoid disclosure of individual company data. |
| Release Date: 8/30/2024 |
| Next Release Date: 8/29/2025 |