|
Download Data (XLS File) |
|
||||||||
|
||||||||
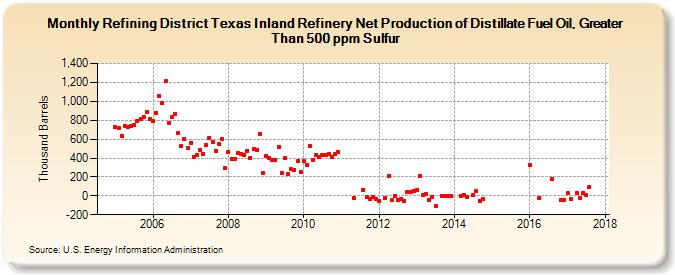
| Refining District Texas Inland Refinery Net Production of Distillate Fuel Oil, Greater Than 500 ppm Sulfur (Thousand Barrels) | ||||||||
| Year | Jan | Feb | Mar | Apr | May | Jun | Jul | Aug | Sep | Oct | Nov | Dec |
|---|---|---|---|---|---|---|---|---|---|---|---|---|
| 2005 | 727 | 722 | 635 | 735 | 725 | 741 | 744 | 795 | 810 | 832 | 884 | 809 |
| 2006 | 794 | 874 | 1,061 | 981 | 1,211 | 772 | 830 | 866 | 660 | 525 | 596 | 508 |
| 2007 | 563 | 415 | 432 | 485 | 447 | 540 | 615 | 569 | 476 | 544 | 602 | 293 |
| 2008 | 461 | 388 | 390 | 454 | 445 | 434 | 477 | 405 | 492 | 488 | 658 | 237 |
| 2009 | 423 | 396 | 383 | 384 | 521 | 243 | 402 | 230 | 282 | 275 | 367 | 254 |
| 2010 | 367 | 326 | 530 | 382 | 437 | 408 | 432 | 430 | 444 | 412 | 442 | 463 |
| 2011 | -23 | 64 | -13 | -37 | -13 | -34 | ||||||
| 2012 | -56 | -23 | 208 | -48 | -5 | -40 | -33 | -53 | 45 | 43 | 52 | |
| 2013 | 66 | 209 | 5 | 18 | -42 | -8 | -110 | 3 | -7 | 3 | 2 | |
| 2014 | 3 | 12 | -8 | 6 | 47 | -50 | -31 | |||||
| 2016 | 324 | -20 | 181 | -45 | -46 | |||||||
| 2017 | 25 | -38 | 30 | -25 | 28 | 8 | 88 | |||||
| - = No Data Reported; -- = Not Applicable; NA = Not Available; W = Withheld to avoid disclosure of individual company data. |
| Release Date: 3/29/2024 |
| Next Release Date: 4/30/2024 |