|
Download Data (XLS File) |
|
||||||||
|
||||||||
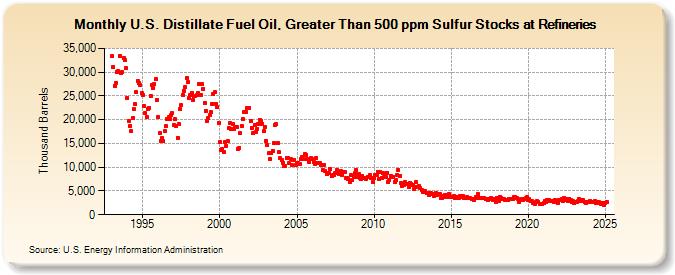
| U.S. Distillate Fuel Oil, Greater Than 500 ppm Sulfur Stocks at Refineries (Thousand Barrels) | ||||||||
| Year | Jan | Feb | Mar | Apr | May | Jun | Jul | Aug | Sep | Oct | Nov | Dec |
|---|---|---|---|---|---|---|---|---|---|---|---|---|
| 1993 | 33,312 | 31,127 | 27,145 | 27,670 | 30,080 | 30,189 | 33,444 | 29,915 | 30,050 | 32,910 | 32,501 | 30,801 |
| 1994 | 24,626 | 19,809 | 18,695 | 17,570 | 20,376 | 22,189 | 23,228 | 25,798 | 28,149 | 27,713 | 27,250 | 25,697 |
| 1995 | 25,246 | 22,900 | 21,336 | 20,618 | 22,313 | 22,553 | 25,065 | 27,294 | 26,566 | 27,403 | 28,486 | 24,202 |
| 1996 | 20,546 | 17,170 | 15,572 | 16,107 | 15,495 | 17,667 | 18,606 | 20,202 | 20,474 | 20,096 | 20,963 | 21,349 |
| 1997 | 18,886 | 20,047 | 18,623 | 16,225 | 19,108 | 22,214 | 23,030 | 25,233 | 26,014 | 26,794 | 28,759 | 27,908 |
| 1998 | 24,579 | 25,142 | 25,577 | 24,166 | 24,947 | 25,028 | 25,139 | 25,571 | 27,479 | 25,201 | 27,411 | 26,537 |
| 1999 | 23,533 | 21,928 | 19,805 | 20,427 | 20,880 | 21,605 | 23,396 | 25,318 | 25,723 | 23,327 | 22,744 | 19,332 |
| 2000 | 15,229 | 13,612 | 13,877 | 13,302 | 15,377 | 14,523 | 15,490 | 18,191 | 19,263 | 18,008 | 18,992 | 18,042 |
| 2001 | 18,392 | 18,369 | 13,910 | 14,144 | 17,241 | 18,717 | 20,072 | 21,653 | 21,621 | 22,417 | 22,351 | 22,503 |
| 2002 | 19,810 | 18,306 | 17,197 | 18,902 | 17,503 | 18,083 | 19,017 | 20,015 | 19,659 | 19,145 | 17,544 | 18,519 |
| 2003 | 15,572 | 14,596 | 12,929 | 11,769 | 12,932 | 13,476 | 15,066 | 18,914 | 19,024 | 15,080 | 13,126 | 11,881 |
| 2004 | 11,439 | 10,978 | 10,348 | 10,156 | 11,995 | 11,924 | 10,788 | 11,732 | 10,391 | 11,578 | 11,536 | 10,427 |
| 2005 | 10,969 | 10,959 | 10,567 | 11,629 | 12,045 | 11,715 | 12,749 | 12,518 | 11,663 | 11,078 | 11,769 | 11,955 |
| 2006 | 11,705 | 11,068 | 10,637 | 11,929 | 10,827 | 10,928 | 10,817 | 10,473 | 9,463 | 10,529 | 9,103 | 8,564 |
| 2007 | 8,847 | 8,827 | 9,597 | 8,194 | 8,332 | 8,302 | 8,690 | 9,444 | 8,725 | 8,661 | 9,113 | 8,323 |
| 2008 | 9,040 | 8,915 | 7,729 | 7,773 | 7,457 | 6,944 | 8,269 | 7,247 | 7,896 | 8,682 | 9,486 | 7,834 |
| 2009 | 8,581 | 7,831 | 7,583 | 8,153 | 7,644 | 7,666 | 7,576 | 8,012 | 8,000 | 8,320 | 7,780 | 6,860 |
| 2010 | 7,637 | 8,333 | 8,459 | 9,061 | 7,530 | 9,005 | 7,769 | 8,705 | 7,897 | 8,011 | 8,841 | 6,779 |
| 2011 | 7,410 | 8,214 | 8,014 | 8,009 | 6,884 | 7,219 | 8,397 | 9,417 | 8,246 | 6,672 | 5,959 | 6,321 |
| 2012 | 6,814 | 6,407 | 6,360 | 5,881 | 6,766 | 6,555 | 6,220 | 5,424 | 5,923 | 6,802 | 5,932 | 6,024 |
| 2013 | 5,547 | 5,102 | 4,806 | 4,849 | 5,001 | 4,526 | 4,620 | 4,216 | 4,578 | 4,370 | 4,427 | 3,994 |
| 2014 | 4,521 | 4,200 | 4,325 | 4,286 | 3,506 | 3,498 | 3,998 | 4,192 | 3,759 | 4,140 | 4,272 | 3,715 |
| 2015 | 3,765 | 3,798 | 3,870 | 3,434 | 3,475 | 3,789 | 3,542 | 3,998 | 3,811 | 3,833 | 3,443 | 3,428 |
| 2016 | 3,647 | 3,545 | 3,511 | 3,464 | 3,289 | 3,352 | 3,144 | 3,692 | 3,466 | 4,309 | 3,603 | 3,497 |
| 2017 | 3,575 | 3,613 | 3,515 | 3,254 | 3,227 | 3,075 | 3,393 | 3,560 | 3,204 | 3,068 | 3,211 | 2,695 |
| 2018 | 3,455 | 2,965 | 3,762 | 3,603 | 3,388 | 3,325 | 3,143 | 3,145 | 3,184 | 3,387 | 3,267 | 3,358 |
| 2019 | 3,218 | 3,681 | 3,727 | 3,572 | 3,336 | 2,682 | 3,095 | 3,328 | 3,166 | 3,336 | 3,445 | 3,639 |
| 2020 | 3,128 | 3,288 | 2,808 | 2,795 | 2,401 | 2,331 | 2,703 | 2,884 | 2,766 | 2,297 | 2,288 | 2,353 |
| 2021 | 2,432 | 2,931 | 2,748 | 3,012 | 3,194 | 2,802 | 2,813 | 2,869 | 2,725 | 3,095 | 2,909 | 2,481 |
| 2022 | 3,139 | 3,028 | 3,355 | 2,851 | 3,604 | 3,147 | 3,226 | 2,979 | 3,410 | 3,074 | 2,777 | 2,797 |
| 2023 | 2,638 | 2,911 | 2,881 | 2,927 | 3,409 | 3,148 | 3,189 | 3,166 | 2,872 | 2,739 | 2,931 | 2,665 |
| 2024 | 2,902 | 2,642 | ||||||||||
| - = No Data Reported; -- = Not Applicable; NA = Not Available; W = Withheld to avoid disclosure of individual company data. |
| Release Date: 4/30/2024 |
| Next Release Date: 5/31/2024 |