|
Download Data (XLS File) |
|
||||||||
|
||||||||
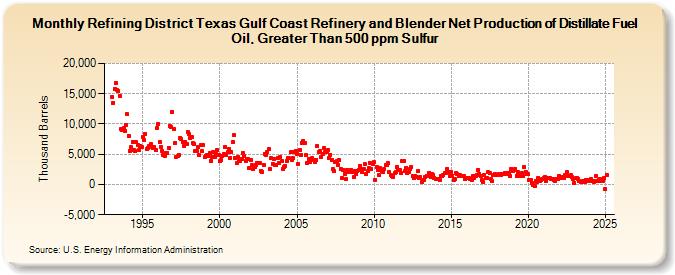
| Refining District Texas Gulf Coast Refinery and Blender Net Production of Distillate Fuel Oil, Greater Than 500 ppm Sulfur (Thousand Barrels) | ||||||||
| Year | Jan | Feb | Mar | Apr | May | Jun | Jul | Aug | Sep | Oct | Nov | Dec |
|---|---|---|---|---|---|---|---|---|---|---|---|---|
| 1993 | 14,537 | 13,477 | 15,835 | 16,776 | 15,590 | 15,484 | 14,666 | 9,134 | 9,077 | 9,280 | 8,861 | 9,876 |
| 1994 | 11,571 | 8,050 | 5,556 | 6,114 | 7,067 | 5,773 | 5,521 | 6,975 | 6,495 | 5,730 | 6,418 | 6,169 |
| 1995 | 7,852 | 7,269 | 8,318 | 5,842 | 6,009 | 6,308 | 6,615 | 6,272 | 5,969 | 6,120 | 5,757 | 9,272 |
| 1996 | 9,996 | 6,974 | 6,267 | 5,562 | 4,882 | 4,741 | 5,207 | 5,281 | 6,099 | 9,644 | 9,502 | 12,058 |
| 1997 | 9,215 | 6,887 | 4,590 | 4,646 | 4,930 | 7,751 | 7,466 | 7,096 | 6,434 | 7,048 | 6,646 | 8,664 |
| 1998 | 8,293 | 7,735 | 7,862 | 6,792 | 6,692 | 5,588 | 5,582 | 6,140 | 4,792 | 6,518 | 5,470 | 6,524 |
| 1999 | 4,527 | 4,707 | 4,892 | 4,713 | 5,181 | 3,904 | 4,564 | 5,370 | 4,613 | 5,076 | 5,662 | 4,917 |
| 2000 | 3,850 | 4,116 | 4,667 | 5,092 | 6,236 | 4,938 | 5,308 | 5,904 | 4,429 | 5,356 | 7,010 | 8,114 |
| 2001 | 4,320 | 3,469 | 4,479 | 3,855 | 3,952 | 4,155 | 5,213 | 4,710 | 3,889 | 4,214 | 4,168 | 2,646 |
| 2002 | 4,027 | 3,202 | 2,475 | 2,928 | 3,199 | 3,563 | 3,604 | 3,502 | 2,229 | 2,122 | 3,281 | 5,107 |
| 2003 | 4,941 | 5,387 | 5,848 | 2,565 | 4,345 | 3,441 | 4,292 | 3,253 | 3,155 | 4,425 | 3,544 | 4,622 |
| 2004 | 3,802 | 2,571 | 2,961 | 3,069 | 3,943 | 4,439 | 4,320 | 5,312 | 4,040 | 4,326 | 5,289 | 5,554 |
| 2005 | 5,028 | 3,442 | 5,730 | 4,952 | 6,906 | 7,242 | 6,877 | 4,857 | 3,514 | 4,187 | 3,677 | 4,098 |
| 2006 | 4,339 | 3,974 | 3,796 | 4,123 | 6,385 | 5,297 | 5,491 | 4,617 | 5,093 | 6,061 | 5,361 | 5,405 |
| 2007 | 5,693 | 4,318 | 4,891 | 4,084 | 2,483 | 2,216 | 3,692 | 3,861 | 3,262 | 4,079 | 2,618 | 1,080 |
| 2008 | 2,400 | 1,778 | 862 | 2,446 | 2,120 | 2,261 | 2,443 | 2,036 | 1,187 | 2,190 | 1,660 | 2,258 |
| 2009 | 2,454 | 3,135 | 2,618 | 2,025 | 2,493 | 3,335 | 1,783 | 2,178 | 2,715 | 3,610 | 2,565 | 3,368 |
| 2010 | 3,635 | 815 | 2,910 | 2,443 | 1,493 | 2,740 | 2,175 | 2,076 | 2,537 | 3,189 | 3,197 | 3,516 |
| 2011 | 2,009 | 1,554 | 1,396 | 1,288 | 1,828 | 2,003 | 2,849 | 2,431 | 2,474 | 1,952 | 3,920 | 3,958 |
| 2012 | 2,156 | 2,781 | 1,928 | 2,073 | 2,616 | 2,884 | 1,392 | 1,126 | 1,403 | 1,308 | 2,176 | 1,141 |
| 2013 | 1,222 | 392 | 689 | 701 | 1,257 | 1,461 | 1,417 | 1,950 | 1,213 | 1,784 | 1,567 | 1,109 |
| 2014 | 868 | 827 | 824 | 662 | 1,424 | 1,418 | 1,552 | 1,861 | 1,908 | 2,604 | 2,026 | 1,425 |
| 2015 | 2,060 | 1,462 | 701 | 835 | 1,960 | 1,684 | 1,425 | 1,520 | 1,321 | 1,382 | 1,409 | 925 |
| 2016 | 1,029 | 1,052 | 1,026 | 925 | 802 | 1,404 | 996 | 1,320 | 1,570 | 2,451 | 1,768 | 1,453 |
| 2017 | 656 | 389 | 1,602 | 1,130 | 1,030 | 2,009 | 1,888 | 837 | 604 | 1,620 | 1,766 | 1,579 |
| 2018 | 1,598 | 1,665 | 1,697 | 1,645 | 1,755 | 1,679 | 1,963 | 1,933 | 1,763 | 1,889 | 1,439 | 2,584 |
| 2019 | 2,172 | 2,421 | 2,636 | 1,442 | 1,983 | 1,679 | 1,336 | 1,835 | 1,430 | 2,912 | 2,129 | 1,741 |
| 2020 | 1,662 | 793 | 768 | 322 | -89 | -304 | 518 | 460 | 1,145 | 578 | 749 | 938 |
| 2021 | 1,137 | 1,309 | 512 | 1,026 | 1,107 | 1,096 | 851 | 880 | 747 | 651 | 952 | 908 |
| 2022 | 1,436 | 1,049 | 1,209 | 1,130 | 1,088 | 1,633 | 1,991 | 1,428 | 1,472 | 1,504 | 1,221 | 967 |
| 2023 | 296 | 1,009 | 1,117 | 1,202 | 946 | 833 | 781 | 1,006 | 843 | 1,082 | 1,149 | 491 |
| 2024 | 725 | 854 | 646 | 476 | ||||||||
| - = No Data Reported; -- = Not Applicable; NA = Not Available; W = Withheld to avoid disclosure of individual company data. |
| Release Date: 6/28/2024 |
| Next Release Date: 7/31/2024 |