|
Download Data (XLS File) |
|
||||||||
|
||||||||
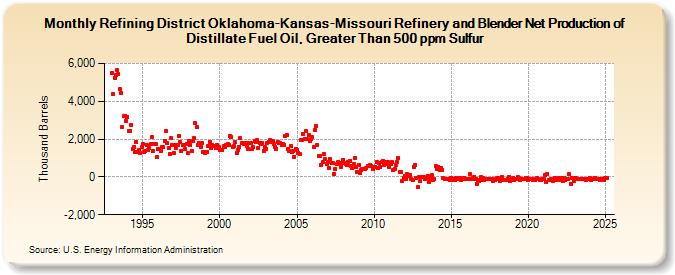
| Refining District Oklahoma-Kansas-Missouri Refinery and Blender Net Production of Distillate Fuel Oil, Greater Than 500 ppm Sulfur (Thousand Barrels) | ||||||||
| Year | Jan | Feb | Mar | Apr | May | Jun | Jul | Aug | Sep | Oct | Nov | Dec |
|---|---|---|---|---|---|---|---|---|---|---|---|---|
| 1993 | 5,497 | 4,397 | 5,254 | 5,393 | 5,640 | 5,436 | 4,625 | 4,435 | 2,653 | 3,203 | 3,235 | 2,952 |
| 1994 | 3,191 | 2,418 | 2,416 | 2,748 | 1,454 | 1,606 | 1,338 | 1,845 | 1,334 | 1,402 | 1,264 | 1,573 |
| 1995 | 1,767 | 1,330 | 1,362 | 1,694 | 1,409 | 1,511 | 1,716 | 2,108 | 1,381 | 1,742 | 1,715 | 1,051 |
| 1996 | 1,466 | 1,496 | 1,368 | 1,591 | 1,563 | 1,902 | 2,438 | 1,795 | 1,543 | 1,220 | 2,048 | 1,680 |
| 1997 | 1,259 | 1,670 | 1,547 | 1,670 | 2,171 | 1,824 | 1,389 | 1,707 | 1,687 | 1,485 | 1,735 | 1,244 |
| 1998 | 1,890 | 1,666 | 1,361 | 1,912 | 2,034 | 2,834 | 2,622 | 1,683 | 1,779 | 1,594 | 1,779 | 1,332 |
| 1999 | 1,291 | 1,340 | 1,340 | 1,634 | 1,829 | 1,516 | 1,684 | 1,654 | 1,649 | 1,533 | 1,681 | 1,580 |
| 2000 | 1,433 | 1,416 | 1,405 | 1,652 | 1,599 | 1,713 | 1,734 | 1,714 | 2,172 | 2,104 | 1,589 | 1,640 |
| 2001 | 1,845 | 1,253 | 1,417 | 1,597 | 2,032 | 1,779 | 1,810 | 1,759 | 1,780 | 1,610 | 1,454 | 1,795 |
| 2002 | 1,802 | 1,487 | 1,561 | 1,894 | 1,831 | 1,942 | 1,543 | 1,812 | 1,765 | 1,774 | 1,383 | 1,563 |
| 2003 | 1,478 | 1,779 | 1,860 | 1,947 | 1,850 | 1,905 | 1,717 | 1,566 | 1,471 | 1,848 | 1,776 | 1,798 |
| 2004 | 1,676 | 1,760 | 1,704 | 2,140 | 2,229 | 1,494 | 1,372 | 1,644 | 1,324 | 1,352 | 1,074 | 1,491 |
| 2005 | 1,426 | 1,263 | 1,191 | 1,966 | 1,978 | 2,262 | 2,021 | 2,418 | 1,979 | 2,233 | 1,906 | 2,022 |
| 2006 | 2,090 | 1,591 | 2,491 | 2,690 | 1,682 | 1,085 | 1,105 | 649 | 799 | 1,219 | 953 | 680 |
| 2007 | 777 | 484 | 939 | 717 | 723 | 157 | 421 | 671 | 775 | 758 | 542 | 722 |
| 2008 | 908 | 756 | 709 | 624 | 776 | 857 | 589 | 451 | 684 | 993 | 521 | 269 |
| 2009 | 605 | 201 | 372 | 407 | 438 | 423 | 466 | 584 | 603 | 645 | 580 | 404 |
| 2010 | 523 | 548 | 799 | 494 | 722 | 522 | 813 | 858 | 648 | 765 | 662 | 772 |
| 2011 | 538 | 675 | 774 | 363 | 406 | 612 | 797 | 1,001 | 235 | 268 | -220 | -35 |
| 2012 | 55 | -95 | 133 | 22 | 124 | -124 | -184 | 530 | 655 | -55 | -525 | -24 |
| 2013 | -242 | 8 | -27 | -20 | -101 | -80 | 74 | -276 | -54 | 82 | -170 | -130 |
| 2014 | 559 | 412 | 549 | 340 | 469 | 384 | -71 | -89 | -121 | -108 | -88 | -140 |
| 2015 | -35 | -155 | -136 | -139 | -36 | -117 | -128 | -79 | -179 | -133 | -79 | -121 |
| 2016 | -130 | -110 | -115 | 134 | -120 | -50 | 13 | -111 | -357 | -179 | -210 | -14 |
| 2017 | -145 | -56 | -168 | -117 | -90 | -134 | -90 | -127 | -91 | -207 | -151 | -133 |
| 2018 | -81 | -50 | -196 | -116 | 6 | -159 | -154 | -165 | -90 | 18 | -209 | -140 |
| 2019 | -51 | -177 | -90 | -85 | -31 | -43 | -144 | -104 | -103 | -102 | -75 | -40 |
| 2020 | -167 | -111 | -114 | -95 | -139 | -189 | -91 | -83 | -108 | -141 | -162 | -89 |
| 2021 | -133 | 91 | -258 | 168 | -147 | -141 | -123 | -194 | -170 | -68 | -156 | -114 |
| 2022 | -38 | -153 | -63 | -204 | -66 | -145 | -117 | -125 | 140 | -351 | -82 | -69 |
| 2023 | -204 | -81 | -103 | -96 | -107 | -85 | -123 | -109 | -107 | -175 | -106 | -133 |
| 2024 | -71 | |||||||||||
| - = No Data Reported; -- = Not Applicable; NA = Not Available; W = Withheld to avoid disclosure of individual company data. |
| Release Date: 3/29/2024 |
| Next Release Date: 4/30/2024 |