|
Download Data (XLS File) |
|
||||||||
|
||||||||
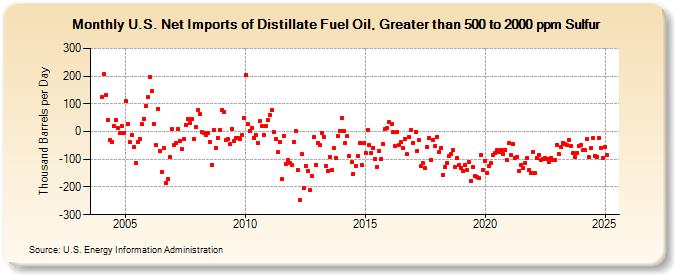
| U.S. Net Imports of Distillate Fuel Oil, Greater than 500 to 2000 ppm Sulfur (Thousand Barrels per Day) | ||||||||
| Year | Jan | Feb | Mar | Apr | May | Jun | Jul | Aug | Sep | Oct | Nov | Dec |
|---|---|---|---|---|---|---|---|---|---|---|---|---|
| 2004 | 124 | 206 | 132 | 43 | -31 | -39 | 20 | 41 | 12 | -5 | 21 | -5 |
| 2005 | 109 | 29 | -37 | -13 | -55 | -113 | -38 | -26 | 27 | 45 | 92 | 123 |
| 2006 | 198 | 145 | 26 | -49 | 82 | -70 | -145 | -58 | -184 | -171 | -92 | 8 |
| 2007 | -50 | -41 | 11 | -35 | -63 | -28 | 24 | 45 | 31 | 46 | -26 | 15 |
| 2008 | 77 | 63 | -1 | -6 | -12 | -7 | -36 | -120 | 6 | -58 | -22 | 5 |
| 2009 | 78 | 70 | -29 | -28 | -46 | 10 | -35 | -25 | -23 | -27 | -14 | 50 |
| 2010 | 204 | 27 | 2 | 13 | -23 | -11 | -41 | 38 | 21 | -12 | 21 | 40 |
| 2011 | 61 | 77 | -1 | -26 | -73 | -37 | -172 | -17 | -116 | -104 | -114 | -120 |
| 2012 | -38 | 3 | -138 | -246 | -81 | -203 | -124 | -144 | -210 | -160 | -20 | -119 |
| 2013 | -40 | -49 | -4 | -18 | -123 | -141 | -91 | -139 | -61 | -96 | -16 | 2 |
| 2014 | 50 | 3 | -43 | -17 | -87 | -111 | -152 | -126 | -88 | -43 | -120 | -43 |
| 2015 | -77 | 4 | -50 | -79 | -58 | -100 | -127 | -69 | -98 | -46 | 11 | 12 |
| 2016 | 34 | 26 | -3 | -53 | -2 | -47 | -39 | -61 | -27 | -82 | -20 | 5 |
| 2017 | -40 | 0 | -69 | -32 | -123 | -115 | -132 | -55 | -24 | -101 | -29 | -51 |
| 2018 | -18 | -72 | -59 | -155 | -128 | -112 | -88 | -80 | -66 | -128 | -95 | -121 |
| 2019 | -130 | -144 | -120 | -140 | -110 | -177 | -128 | -161 | -165 | -168 | -84 | -137 |
| 2020 | -105 | -149 | -124 | -115 | -83 | -77 | -66 | -73 | -65 | -81 | -66 | -102 |
| 2021 | -42 | -85 | -46 | -96 | -91 | -143 | -121 | -132 | -112 | -97 | -140 | -148 |
| 2022 | -75 | -151 | -96 | -86 | -103 | -100 | -96 | -98 | -109 | -94 | -102 | -101 |
| 2023 | -61 | -70 | -66 | -50 | -48 | -64 | -51 | -67 | -69 | -92 | -76 | -51 |
| 2024 | -48 | |||||||||||
| - = No Data Reported; -- = Not Applicable; NA = Not Available; W = Withheld to avoid disclosure of individual company data. |
| Release Date: 3/29/2024 |
| Next Release Date: 4/30/2024 |