|
Download Data (XLS File) |
|
||||||||
|
||||||||
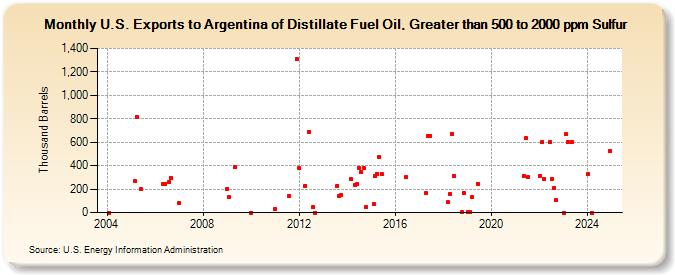
| U.S. Exports to Argentina of Distillate Fuel Oil, Greater than 500 to 2000 ppm Sulfur (Thousand Barrels) | ||||||||
| Year | Jan | Feb | Mar | Apr | May | Jun | Jul | Aug | Sep | Oct | Nov | Dec |
|---|---|---|---|---|---|---|---|---|---|---|---|---|
| 2004 | 0 | |||||||||||
| 2005 | 265 | 813 | 197 | |||||||||
| 2006 | 240 | 242 | 257 | 293 | ||||||||
| 2007 | 81 | |||||||||||
| 2009 | 205 | 130 | 389 | |||||||||
| 2010 | 0 | |||||||||||
| 2011 | 28 | 145 | 1,309 | |||||||||
| 2012 | 376 | 230 | 690 | 44 | 0 | |||||||
| 2013 | 230 | 145 | 150 | |||||||||
| 2014 | 282 | 234 | 245 | 376 | 345 | 379 | 49 | |||||
| 2015 | 75 | 315 | 330 | 474 | 330 | |||||||
| 2016 | 300 | |||||||||||
| 2017 | 164 | 651 | 651 | |||||||||
| 2018 | 90 | 158 | 674 | 315 | 3 | 171 | ||||||
| 2019 | 3 | 6 | 130 | 246 | ||||||||
| 2021 | 314 | 633 | 307 | |||||||||
| 2022 | 314 | 599 | 285 | 598 | 290 | 209 | 106 | |||||
| 2023 | 299 | 669 | 600 | 600 | ||||||||
| 2024 | 328 | |||||||||||
| - = No Data Reported; -- = Not Applicable; NA = Not Available; W = Withheld to avoid disclosure of individual company data. |
| Release Date: 3/29/2024 |
| Next Release Date: 4/30/2024 |