|
Download Data (XLS File) |
|
||||||||
|
||||||||
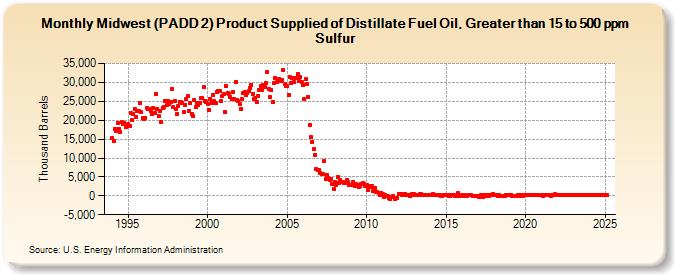
| Midwest (PADD 2) Product Supplied of Distillate Fuel Oil, Greater than 15 to 500 ppm Sulfur (Thousand Barrels) | ||||||||
| Year | Jan | Feb | Mar | Apr | May | Jun | Jul | Aug | Sep | Oct | Nov | Dec |
|---|---|---|---|---|---|---|---|---|---|---|---|---|
| 1994 | 15,332 | 14,519 | 17,794 | 17,181 | 19,341 | 17,757 | 16,812 | 19,495 | 19,094 | 19,263 | 18,087 | 18,495 |
| 1995 | 18,905 | 18,448 | 21,863 | 19,973 | 21,689 | 22,912 | 20,913 | 22,447 | 22,523 | 24,592 | 22,037 | 20,625 |
| 1996 | 20,225 | 20,664 | 23,139 | 22,835 | 23,083 | 22,424 | 21,568 | 23,188 | 21,928 | 26,911 | 23,028 | 21,038 |
| 1997 | 22,401 | 19,590 | 23,299 | 23,532 | 25,124 | 23,905 | 25,004 | 24,328 | 24,884 | 28,367 | 23,376 | 25,142 |
| 1998 | 22,909 | 21,689 | 23,796 | 24,780 | 24,726 | 24,632 | 22,199 | 24,021 | 25,736 | 26,433 | 22,545 | 24,436 |
| 1999 | 21,738 | 21,007 | 25,229 | 23,414 | 24,421 | 24,038 | 24,667 | 25,913 | 25,816 | 28,783 | 25,057 | 24,911 |
| 2000 | 24,323 | 22,767 | 25,614 | 24,632 | 26,761 | 24,989 | 24,441 | 27,518 | 27,772 | 27,686 | 25,076 | 26,501 |
| 2001 | 26,903 | 22,235 | 29,003 | 27,288 | 26,875 | 26,252 | 25,641 | 27,344 | 25,524 | 30,106 | 25,431 | 25,028 |
| 2002 | 24,249 | 22,907 | 25,666 | 27,121 | 27,586 | 26,584 | 27,110 | 27,752 | 28,618 | 29,434 | 27,018 | 25,647 |
| 2003 | 25,999 | 24,730 | 26,517 | 27,881 | 29,087 | 27,964 | 29,364 | 28,791 | 29,738 | 32,688 | 28,220 | 26,004 |
| 2004 | 27,954 | 24,691 | 29,775 | 31,257 | 30,065 | 30,276 | 30,971 | 30,467 | 30,587 | 33,288 | 29,483 | 29,161 |
| 2005 | 29,004 | 26,556 | 31,546 | 29,889 | 31,126 | 30,033 | 31,237 | 31,162 | 32,094 | 30,463 | 31,426 | 30,096 |
| 2006 | 29,421 | 25,522 | 30,827 | 29,461 | 26,216 | 18,789 | 15,454 | 14,334 | 12,279 | 10,753 | 7,073 | 6,726 |
| 2007 | 6,839 | 5,971 | 5,821 | 5,690 | 9,175 | 4,488 | 5,467 | 4,744 | 4,310 | 4,485 | 3,238 | 1,842 |
| 2008 | 3,718 | 2,813 | 5,045 | 3,286 | 4,191 | 3,778 | 3,588 | 3,414 | 3,347 | 4,163 | 3,538 | 2,876 |
| 2009 | 2,939 | 2,821 | 3,558 | 2,618 | 3,201 | 2,929 | 2,378 | 2,488 | 3,009 | 3,329 | 3,160 | 2,517 |
| 2010 | 2,802 | 1,573 | 2,554 | 2,205 | 2,477 | 1,320 | 1,940 | 1,021 | 1,074 | 796 | 271 | 750 |
| 2011 | 464 | -186 | 216 | -92 | -26 | -503 | -785 | -390 | -130 | -765 | -578 | -491 |
| 2012 | 591 | 453 | 491 | 222 | 451 | 505 | 255 | 169 | 215 | 76 | 378 | 239 |
| 2013 | 443 | 342 | 287 | 272 | 357 | 385 | 242 | 222 | 253 | 145 | 104 | 293 |
| 2014 | 309 | 277 | 352 | 200 | 285 | 160 | 234 | 99 | -148 | -25 | 241 | 293 |
| 2015 | 114 | 143 | 43 | 68 | 182 | 89 | 177 | 30 | -107 | 629 | 48 | -159 |
| 2016 | 83 | 15 | 298 | -36 | 73 | 91 | 171 | 109 | -140 | -152 | -81 | 49 |
| 2017 | 40 | -187 | 83 | 141 | -210 | 87 | -77 | 90 | 33 | 102 | 154 | 430 |
| 2018 | 202 | 224 | 230 | 64 | 185 | -74 | 11 | 48 | 18 | 316 | 250 | 117 |
| 2019 | 208 | 218 | 12 | 54 | -15 | -34 | 84 | 161 | -70 | 97 | -47 | 236 |
| 2020 | 96 | 100 | 167 | 217 | 238 | 165 | 236 | 261 | 211 | 235 | 163 | 177 |
| 2021 | 128 | 53 | 144 | 246 | 100 | 139 | 229 | 48 | 192 | 286 | 364 | 198 |
| 2022 | 160 | 140 | 256 | 325 | 165 | 225 | 260 | 117 | 146 | 102 | 231 | 138 |
| 2023 | 279 | 137 | 229 | 159 | 195 | 167 | 242 | 219 | 229 | 210 | 215 | 246 |
| 2024 | 225 | 124 | 293 | 213 | 215 | 190 | 160 | 234 | 206 | 178 | 226 | 342 |
| 2025 | 220 | 95 | 204 | 211 | ||||||||
| - = No Data Reported; -- = Not Applicable; NA = Not Available; W = Withheld to avoid disclosure of individual company data. |
| Release Date: 6/30/2025 |
| Next Release Date: 7/31/2025 |