|
Download Data (XLS File) |
|
||||||||
|
||||||||
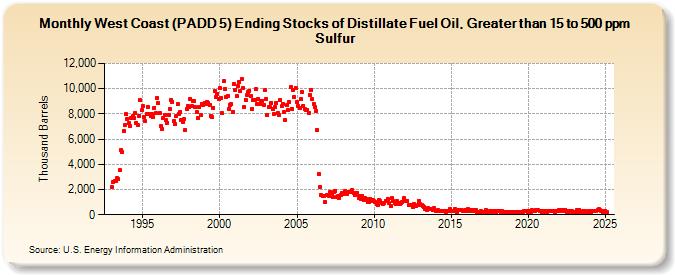
| West Coast (PADD 5) Ending Stocks of Distillate Fuel Oil, Greater than 15 to 500 ppm Sulfur (Thousand Barrels) | ||||||||
| Year | Jan | Feb | Mar | Apr | May | Jun | Jul | Aug | Sep | Oct | Nov | Dec |
|---|---|---|---|---|---|---|---|---|---|---|---|---|
| 1993 | 2,168 | 2,609 | 2,647 | 2,642 | 2,876 | 2,823 | 3,537 | 5,127 | 4,961 | 6,658 | 7,122 | 7,971 |
| 1994 | 7,623 | 7,250 | 7,072 | 7,681 | 7,802 | 7,651 | 8,084 | 7,276 | 7,151 | 7,856 | 9,096 | 8,279 |
| 1995 | 8,612 | 7,789 | 7,410 | 7,992 | 8,556 | 7,961 | 7,811 | 7,978 | 7,733 | 8,495 | 8,065 | 9,250 |
| 1996 | 8,872 | 8,062 | 7,032 | 6,810 | 7,672 | 7,907 | 7,477 | 7,315 | 7,932 | 8,380 | 9,090 | 8,951 |
| 1997 | 7,418 | 7,167 | 7,802 | 8,794 | 8,003 | 8,168 | 7,533 | 7,381 | 7,566 | 6,721 | 8,373 | 8,613 |
| 1998 | 8,530 | 9,198 | 8,588 | 9,051 | 8,992 | 8,510 | 8,129 | 7,676 | 8,526 | 7,899 | 8,797 | 8,737 |
| 1999 | 8,886 | 8,763 | 8,978 | 8,857 | 8,685 | 7,866 | 7,717 | 8,500 | 9,805 | 9,313 | 9,612 | 9,163 |
| 2000 | 10,015 | 9,232 | 8,050 | 10,602 | 9,996 | 9,339 | 9,449 | 8,409 | 8,707 | 8,748 | 8,167 | 10,355 |
| 2001 | 9,923 | 9,424 | 10,198 | 10,515 | 9,797 | 10,758 | 10,041 | 8,553 | 9,142 | 9,463 | 9,735 | 9,854 |
| 2002 | 9,432 | 8,409 | 9,063 | 9,105 | 9,960 | 8,750 | 9,175 | 8,748 | 9,028 | 9,027 | 8,701 | 9,860 |
| 2003 | 9,219 | 7,896 | 8,546 | 8,511 | 8,902 | 8,412 | 8,026 | 8,549 | 8,889 | 8,059 | 7,918 | 9,129 |
| 2004 | 8,587 | 8,776 | 8,185 | 7,509 | 8,680 | 8,270 | 8,923 | 10,149 | 8,412 | 9,918 | 9,337 | 10,062 |
| 2005 | 8,920 | 8,628 | 8,452 | 9,158 | 9,740 | 8,658 | 8,349 | 8,283 | 8,320 | 8,062 | 9,502 | 9,915 |
| 2006 | 9,175 | 8,807 | 8,525 | 8,237 | 6,695 | 3,226 | 2,214 | 1,548 | 1,497 | 1,515 | 1,004 | 1,555 |
| 2007 | 1,571 | 1,464 | 1,803 | 1,692 | 1,402 | 1,836 | 1,869 | 1,440 | 1,485 | 1,362 | 1,598 | 1,753 |
| 2008 | 1,617 | 1,870 | 1,732 | 1,648 | 1,819 | 1,799 | 1,774 | 1,995 | 1,737 | 1,557 | 1,610 | 1,727 |
| 2009 | 1,362 | 1,463 | 1,267 | 1,486 | 1,175 | 1,303 | 1,263 | 972 | 1,012 | 1,268 | 1,101 | 1,156 |
| 2010 | 1,065 | 1,017 | 825 | 785 | 1,207 | 1,096 | 945 | 862 | 913 | 1,107 | 1,081 | 1,232 |
| 2011 | 905 | 715 | 1,301 | 1,091 | 891 | 870 | 1,054 | 946 | 816 | 919 | 1,035 | 1,287 |
| 2012 | 1,113 | 1,116 | 1,109 | 754 | 806 | 809 | 626 | 831 | 693 | 686 | 734 | 1,119 |
| 2013 | 841 | 759 | 713 | 594 | 483 | 398 | 503 | 477 | 476 | 464 | 394 | 514 |
| 2014 | 318 | 321 | 359 | 313 | 321 | 313 | 286 | 303 | 183 | 295 | 274 | 420 |
| 2015 | 329 | 282 | 257 | 484 | 338 | 166 | 348 | 366 | 383 | 332 | 298 | 341 |
| 2016 | 285 | 439 | 260 | 375 | 298 | 343 | 331 | 385 | 253 | 218 | 187 | 267 |
| 2017 | 168 | 221 | 180 | 372 | 221 | 239 | 262 | 260 | 222 | 279 | 277 | 240 |
| 2018 | 320 | 303 | 295 | 205 | 282 | 225 | 148 | 248 | 235 | 216 | 231 | 244 |
| 2019 | 240 | 218 | 177 | 170 | 255 | 250 | 226 | 245 | 177 | 262 | 257 | 276 |
| 2020 | 191 | 293 | 238 | 342 | 269 | 318 | 372 | 398 | 335 | 332 | 309 | 214 |
| 2021 | 273 | 202 | 291 | 216 | 296 | 294 | 291 | 297 | 276 | 224 | 257 | 267 |
| 2022 | 337 | 312 | 369 | 407 | 299 | 396 | 250 | 277 | 224 | 285 | 296 | 232 |
| 2023 | 237 | 194 | 389 | 208 | 407 | 254 | 148 | 266 | 314 | 241 | 212 | 265 |
| 2024 | 229 | |||||||||||
| - = No Data Reported; -- = Not Applicable; NA = Not Available; W = Withheld to avoid disclosure of individual company data. |
| Release Date: 3/29/2024 |
| Next Release Date: 4/30/2024 |