|
Download Data (XLS File) |
|
||||||||
|
||||||||
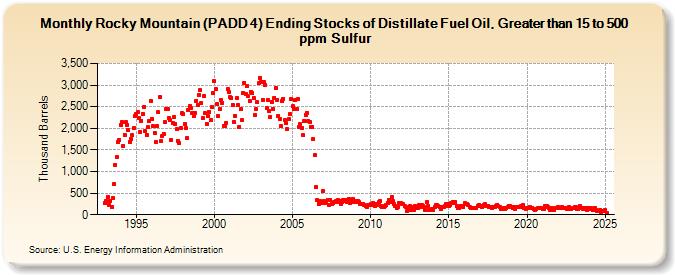
| Rocky Mountain (PADD 4) Ending Stocks of Distillate Fuel Oil, Greater than 15 to 500 ppm Sulfur (Thousand Barrels) | ||||||||
| Year | Jan | Feb | Mar | Apr | May | Jun | Jul | Aug | Sep | Oct | Nov | Dec |
|---|---|---|---|---|---|---|---|---|---|---|---|---|
| 1993 | 262 | 321 | 409 | 231 | 321 | 188 | 389 | 715 | 1,153 | 1,327 | 1,683 | 1,731 |
| 1994 | 2,066 | 2,139 | 1,597 | 1,855 | 2,137 | 2,086 | 1,949 | 1,686 | 1,750 | 1,835 | 2,010 | 2,285 |
| 1995 | 2,323 | 2,368 | 2,238 | 1,915 | 2,180 | 2,337 | 2,498 | 1,930 | 1,852 | 2,029 | 2,166 | 2,635 |
| 1996 | 2,216 | 2,044 | 1,901 | 1,687 | 2,055 | 2,367 | 2,723 | 1,703 | 1,830 | 1,868 | 2,135 | 2,456 |
| 1997 | 2,455 | 2,239 | 2,184 | 1,724 | 2,113 | 2,260 | 2,104 | 1,981 | 1,713 | 1,654 | 2,017 | 2,344 |
| 1998 | 2,326 | 2,098 | 2,000 | 1,768 | 2,430 | 2,511 | 2,463 | 2,358 | 2,281 | 2,365 | 2,638 | 2,538 |
| 1999 | 2,773 | 2,875 | 2,582 | 2,230 | 2,753 | 2,344 | 2,104 | 2,279 | 2,388 | 2,186 | 2,495 | 2,814 |
| 2000 | 3,087 | 2,900 | 2,565 | 2,282 | 2,438 | 2,651 | 2,593 | 2,062 | 2,042 | 2,133 | 2,902 | 2,835 |
| 2001 | 2,724 | 2,710 | 2,547 | 2,152 | 2,286 | 2,701 | 2,544 | 2,040 | 2,441 | 2,190 | 2,823 | 3,059 |
| 2002 | 2,799 | 2,979 | 2,739 | 2,640 | 2,843 | 2,808 | 2,707 | 2,313 | 2,436 | 2,605 | 3,040 | 3,170 |
| 2003 | 3,079 | 2,666 | 3,071 | 3,013 | 2,467 | 2,651 | 2,390 | 2,262 | 2,615 | 2,452 | 2,709 | 2,938 |
| 2004 | 2,662 | 2,296 | 2,225 | 2,044 | 2,633 | 2,685 | 2,197 | 2,113 | 1,973 | 2,204 | 2,328 | 2,670 |
| 2005 | 2,508 | 2,453 | 2,665 | 2,455 | 2,675 | 2,028 | 2,099 | 2,017 | 1,837 | 2,172 | 2,315 | 2,361 |
| 2006 | 2,168 | 2,135 | 2,033 | 2,034 | 1,745 | 1,381 | 636 | 340 | 256 | 313 | 269 | 538 |
| 2007 | 313 | 280 | 291 | 341 | 225 | 349 | 258 | 267 | 303 | 308 | 289 | 339 |
| 2008 | 309 | 252 | 288 | 344 | 322 | 334 | 292 | 362 | 278 | 321 | 374 | 299 |
| 2009 | 311 | 301 | 308 | 288 | 254 | 249 | 242 | 224 | 205 | 185 | 218 | 217 |
| 2010 | 242 | 230 | 273 | 209 | 251 | 231 | 284 | 314 | 211 | 179 | 167 | 199 |
| 2011 | 225 | 281 | 331 | 299 | 401 | 313 | 238 | 201 | 156 | 185 | 276 | 279 |
| 2012 | 244 | 245 | 194 | 176 | 89 | 116 | 191 | 183 | 114 | 116 | 194 | 156 |
| 2013 | 164 | 218 | 179 | 214 | 210 | 170 | 117 | 294 | 203 | 120 | 105 | 139 |
| 2014 | 116 | 178 | 215 | 215 | 199 | 173 | 124 | 190 | 176 | 198 | 238 | 240 |
| 2015 | 197 | 217 | 272 | 303 | 268 | 293 | 193 | 155 | 156 | 212 | 201 | 187 |
| 2016 | 265 | 237 | 258 | 229 | 175 | 148 | 146 | 145 | 158 | 159 | 196 | 220 |
| 2017 | 210 | 190 | 210 | 234 | 247 | 212 | 199 | 168 | 180 | 164 | 180 | 172 |
| 2018 | 211 | 231 | 195 | 190 | 140 | 140 | 154 | 140 | 148 | 172 | 210 | 201 |
| 2019 | 181 | 159 | 172 | 142 | 179 | 169 | 172 | 193 | 184 | 221 | 146 | 138 |
| 2020 | 147 | 150 | 183 | 154 | 156 | 125 | 119 | 125 | 145 | 145 | 151 | 153 |
| 2021 | 139 | 143 | 208 | 200 | 167 | 150 | 120 | 144 | 114 | 118 | 153 | 163 |
| 2022 | 173 | 151 | 163 | 185 | 165 | 145 | 164 | 138 | 167 | 122 | 127 | 148 |
| 2023 | 147 | 188 | 136 | 143 | 176 | 203 | 150 | 138 | 163 | 151 | 115 | 147 |
| 2024 | 136 | |||||||||||
| - = No Data Reported; -- = Not Applicable; NA = Not Available; W = Withheld to avoid disclosure of individual company data. |
| Release Date: 3/29/2024 |
| Next Release Date: 4/30/2024 |