|
Download Data (XLS File) |
|
||||||||
|
||||||||
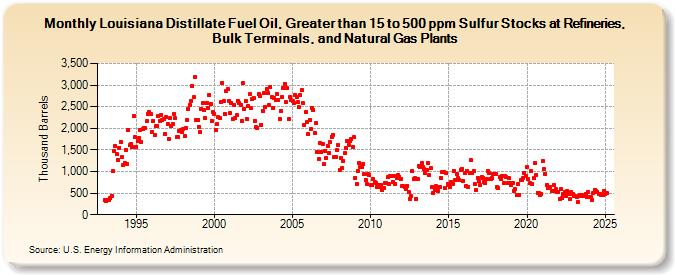
| Louisiana Distillate Fuel Oil, Greater than 15 to 500 ppm Sulfur Stocks at Refineries, Bulk Terminals, and Natural Gas Plants (Thousand Barrels) | ||||||||
| Year | Jan | Feb | Mar | Apr | May | Jun | Jul | Aug | Sep | Oct | Nov | Dec |
|---|---|---|---|---|---|---|---|---|---|---|---|---|
| 1993 | 343 | 316 | 348 | 343 | 385 | 444 | 1,010 | 1,485 | 1,594 | 1,397 | 1,261 | 1,550 |
| 1994 | 1,683 | 1,326 | 1,157 | 1,200 | 1,509 | 1,168 | 1,971 | 1,604 | 1,646 | 1,575 | 2,283 | 1,791 |
| 1995 | 1,578 | 1,695 | 1,767 | 1,968 | 1,678 | 1,974 | 2,014 | 1,997 | 2,158 | 2,342 | 2,371 | 2,329 |
| 1996 | 1,925 | 2,174 | 1,838 | 2,054 | 2,055 | 2,279 | 2,165 | 2,311 | 2,181 | 2,209 | 1,858 | 2,261 |
| 1997 | 2,108 | 1,748 | 2,232 | 2,046 | 2,098 | 2,335 | 2,229 | 1,798 | 1,807 | 1,947 | 1,953 | 1,914 |
| 1998 | 1,976 | 1,812 | 1,998 | 2,196 | 2,450 | 2,537 | 2,636 | 2,975 | 2,717 | 3,183 | 2,182 | 2,189 |
| 1999 | 2,041 | 1,908 | 2,455 | 2,575 | 2,423 | 2,230 | 2,583 | 2,481 | 2,770 | 2,564 | 2,178 | 2,379 |
| 2000 | 2,333 | 1,955 | 2,096 | 2,254 | 2,237 | 2,599 | 3,056 | 2,622 | 2,338 | 2,855 | 2,906 | 2,637 |
| 2001 | 2,345 | 2,587 | 2,218 | 2,541 | 2,233 | 2,300 | 2,643 | 2,578 | 2,542 | 2,178 | 3,046 | 2,438 |
| 2002 | 2,624 | 2,207 | 2,505 | 2,783 | 2,461 | 2,671 | 2,709 | 2,169 | 2,026 | 2,014 | 2,789 | 2,753 |
| 2003 | 2,084 | 2,397 | 2,822 | 2,485 | 2,906 | 2,816 | 2,533 | 2,952 | 2,726 | 2,477 | 2,691 | 2,652 |
| 2004 | 2,800 | 2,662 | 2,211 | 2,403 | 2,721 | 2,936 | 3,026 | 2,597 | 2,925 | 2,214 | 2,717 | 2,648 |
| 2005 | 2,629 | 2,587 | 2,770 | 2,731 | 2,601 | 2,486 | 2,759 | 2,894 | 2,579 | 2,082 | 2,382 | 2,142 |
| 2006 | 1,860 | 2,190 | 1,987 | 2,478 | 2,425 | 1,886 | 2,124 | 1,461 | 1,288 | 1,652 | 1,450 | 1,640 |
| 2007 | 1,164 | 1,466 | 1,322 | 1,601 | 1,439 | 1,674 | 1,806 | 1,852 | 1,338 | 1,334 | 1,501 | 1,618 |
| 2008 | 1,040 | 1,324 | 1,077 | 1,245 | 1,427 | 1,548 | 1,706 | 1,616 | 1,711 | 1,752 | 1,562 | 1,794 |
| 2009 | 861 | 712 | 1,015 | 1,192 | 1,109 | 1,094 | 1,175 | 932 | 814 | 712 | 948 | 914 |
| 2010 | 683 | 681 | 820 | 760 | 733 | 638 | 684 | 639 | 693 | 567 | 629 | 727 |
| 2011 | 729 | 872 | 709 | 897 | 892 | 765 | 906 | 720 | 846 | 920 | 880 | 819 |
| 2012 | 656 | 655 | 633 | 599 | 673 | 517 | 372 | 433 | 1,007 | 830 | 839 | 362 |
| 2013 | 816 | 1,120 | 1,108 | 1,195 | 1,095 | 1,049 | 967 | 1,035 | 1,200 | 914 | 1,072 | 642 |
| 2014 | 497 | 576 | 658 | 637 | 551 | 648 | 858 | 986 | 979 | 629 | 966 | 722 |
| 2015 | 682 | 635 | 761 | 706 | 1,019 | 798 | 939 | 850 | 807 | 1,031 | 1,064 | 775 |
| 2016 | 959 | 660 | 1,014 | 648 | 958 | 1,260 | 956 | 1,023 | 713 | 567 | 857 | 769 |
| 2017 | 678 | 868 | 847 | 763 | 730 | 822 | 1,004 | 961 | 831 | 842 | 946 | 951 |
| 2018 | 943 | 640 | 617 | 863 | 838 | 889 | 725 | 888 | 868 | 733 | 853 | 733 |
| 2019 | 677 | 723 | 553 | 586 | 445 | 704 | 463 | 799 | 813 | 852 | 973 | 903 |
| 2020 | 1,115 | 818 | 725 | 1,011 | 713 | 843 | 1,205 | 922 | 512 | 513 | 465 | 479 |
| 2021 | 1,244 | 1,063 | 947 | 685 | 619 | 652 | 632 | 559 | 551 | 684 | 585 | 525 |
| 2022 | 529 | 353 | 590 | 388 | 477 | 521 | 426 | 548 | 475 | 365 | 515 | 477 |
| 2023 | 422 | 429 | 412 | 295 | 437 | 462 | 455 | 423 | 436 | 489 | 421 | 525 |
| 2024 | 411 | |||||||||||
| - = No Data Reported; -- = Not Applicable; NA = Not Available; W = Withheld to avoid disclosure of individual company data. |
| Release Date: 3/29/2024 |
| Next Release Date: 4/30/2024 |