|
Download Data (XLS File) |
|
||||||||
|
||||||||
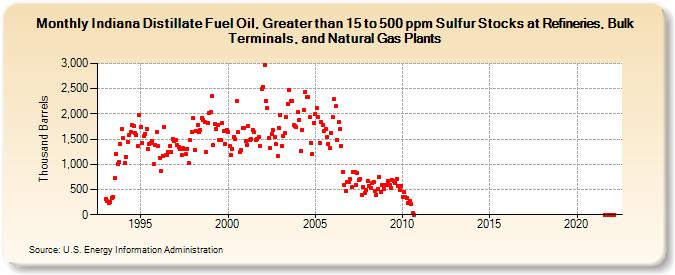
| Indiana Distillate Fuel Oil, Greater than 15 to 500 ppm Sulfur Stocks at Refineries, Bulk Terminals, and Natural Gas Plants (Thousand Barrels) | ||||||||
| Year | Jan | Feb | Mar | Apr | May | Jun | Jul | Aug | Sep | Oct | Nov | Dec |
|---|---|---|---|---|---|---|---|---|---|---|---|---|
| 1993 | 310 | 263 | 241 | 262 | 333 | 357 | 734 | 1,209 | 1,010 | 1,040 | 1,393 | 1,705 |
| 1994 | 1,523 | 1,017 | 1,154 | 1,449 | 1,576 | 1,639 | 1,779 | 1,758 | 1,614 | 1,575 | 1,359 | 1,980 |
| 1995 | 1,747 | 1,431 | 1,560 | 1,604 | 1,707 | 1,306 | 1,393 | 1,429 | 1,457 | 1,000 | 1,390 | 1,643 |
| 1996 | 1,354 | 1,134 | 859 | 1,169 | 1,745 | 1,178 | 1,176 | 1,245 | 1,367 | 1,243 | 1,496 | 1,458 |
| 1997 | 1,481 | 1,392 | 1,334 | 1,310 | 1,184 | 1,316 | 1,297 | 1,201 | 1,309 | 1,016 | 1,476 | 1,643 |
| 1998 | 1,920 | 1,278 | 1,666 | 1,779 | 1,633 | 1,687 | 1,922 | 1,879 | 1,841 | 1,243 | 1,813 | 2,008 |
| 1999 | 2,038 | 2,353 | 1,375 | 1,806 | 1,694 | 1,785 | 1,488 | 1,477 | 1,819 | 1,655 | 1,410 | 1,686 |
| 2000 | 1,640 | 1,357 | 1,175 | 1,311 | 1,547 | 1,496 | 2,251 | 1,639 | 1,235 | 1,282 | 1,718 | 1,725 |
| 2001 | 1,460 | 1,392 | 1,750 | 1,484 | 1,495 | 1,679 | 1,633 | 1,484 | 1,498 | 1,540 | 1,366 | 2,487 |
| 2002 | 2,539 | 2,973 | 2,264 | 2,113 | 1,518 | 1,331 | 1,605 | 1,673 | 1,548 | 1,394 | 1,168 | 1,712 |
| 2003 | 1,982 | 1,369 | 1,565 | 1,627 | 1,937 | 2,204 | 2,471 | 2,259 | 2,262 | 1,773 | 1,758 | 1,734 |
| 2004 | 2,034 | 1,885 | 1,272 | 1,683 | 2,083 | 2,440 | 2,330 | 2,342 | 1,929 | 1,431 | 1,209 | 1,816 |
| 2005 | 2,001 | 2,124 | 1,939 | 1,426 | 1,848 | 1,778 | 1,659 | 1,701 | 1,543 | 1,409 | 1,314 | 1,630 |
| 2006 | 1,936 | 2,292 | 2,154 | 1,487 | 1,836 | 1,692 | 1,367 | 849 | 584 | 462 | 642 | 657 |
| 2007 | 718 | 547 | 846 | 848 | 595 | 823 | 696 | 711 | 397 | 540 | 422 | 490 |
| 2008 | 670 | 575 | 526 | 634 | 657 | 472 | 399 | 508 | 755 | 459 | 588 | 516 |
| 2009 | 584 | 595 | 666 | 587 | 525 | 686 | 659 | 638 | 710 | 568 | 500 | 571 |
| 2010 | 361 | 449 | 344 | 338 | 240 | 268 | 212 | 25 | 2 | |||
| 2021 | 0 | 0 | 0 | |||||||||
| 2022 | 0 | 0 | ||||||||||
| - = No Data Reported; -- = Not Applicable; NA = Not Available; W = Withheld to avoid disclosure of individual company data. |
| Release Date: 3/29/2024 |
| Next Release Date: 4/30/2024 |