|
Download Data (XLS File) |
|
||||||||
|
||||||||
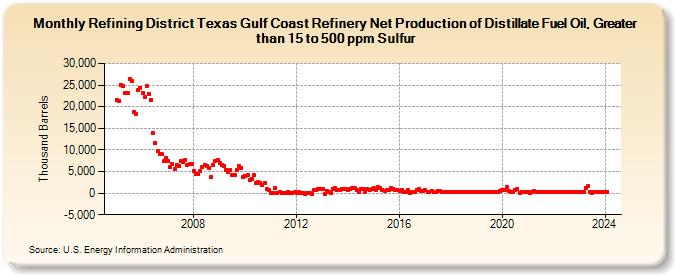
| Refining District Texas Gulf Coast Refinery Net Production of Distillate Fuel Oil, Greater than 15 to 500 ppm Sulfur (Thousand Barrels) | ||||||||
| Year | Jan | Feb | Mar | Apr | May | Jun | Jul | Aug | Sep | Oct | Nov | Dec |
|---|---|---|---|---|---|---|---|---|---|---|---|---|
| 2005 | 21,636 | 21,394 | 24,985 | 24,761 | 23,144 | 23,175 | 26,338 | 25,959 | 18,680 | 18,352 | 23,769 | 24,375 |
| 2006 | 23,130 | 22,156 | 24,794 | 22,891 | 21,609 | 14,017 | 11,573 | 9,856 | 9,143 | 8,951 | 7,353 | 8,119 |
| 2007 | 7,331 | 6,117 | 6,689 | 5,474 | 6,520 | 6,172 | 7,484 | 7,274 | 7,609 | 6,591 | 6,684 | 6,676 |
| 2008 | 5,193 | 4,419 | 4,446 | 5,032 | 6,123 | 6,579 | 6,205 | 5,823 | 3,722 | 6,398 | 7,328 | 7,608 |
| 2009 | 6,903 | 6,589 | 6,223 | 5,454 | 4,886 | 5,372 | 4,297 | 4,279 | 5,387 | 6,241 | 5,786 | 3,675 |
| 2010 | 3,949 | 4,184 | 2,966 | 3,359 | 4,218 | 2,232 | 2,547 | 2,417 | 1,907 | 2,263 | 854 | 635 |
| 2011 | 40 | -4 | 1,236 | 52 | 151 | 35 | -37 | 85 | 294 | 39 | 55 | 229 |
| 2012 | 15 | 294 | 55 | 33 | -164 | -34 | 88 | -159 | 618 | 753 | 1,006 | 1,037 |
| 2013 | 899 | -151 | 559 | 322 | 40 | 1,015 | 1,081 | 713 | 616 | 847 | 969 | 936 |
| 2014 | 779 | 1,007 | 1,240 | 1,133 | 715 | 275 | 1,044 | 914 | 305 | 1,060 | 610 | 940 |
| 2015 | 1,106 | 785 | 1,316 | 1,239 | 833 | 603 | 624 | 831 | 1,104 | 1,034 | 823 | 750 |
| 2016 | 522 | 792 | 323 | 355 | 692 | 124 | 229 | 249 | 630 | 837 | 452 | 513 |
| 2017 | 608 | 276 | 172 | 407 | 239 | 305 | 551 | 378 | 236 | 364 | 296 | 328 |
| 2018 | 301 | 216 | 272 | 277 | 281 | 252 | 226 | 207 | 256 | 321 | 326 | 282 |
| 2019 | 229 | 286 | 325 | 331 | 270 | 323 | 306 | 294 | 216 | 368 | 334 | 531 |
| 2020 | 688 | 747 | 1,338 | 381 | 296 | 263 | 802 | 892 | 103 | 298 | 287 | 228 |
| 2021 | 315 | -24 | 237 | 459 | 305 | 226 | 246 | 223 | 264 | 237 | 206 | 217 |
| 2022 | 161 | 222 | 220 | 268 | 265 | 249 | 286 | 292 | 314 | 319 | 315 | 218 |
| 2023 | 217 | 198 | 291 | 1,268 | 1,636 | 267 | -19 | 247 | 269 | 268 | 253 | 278 |
| 2024 | 265 | |||||||||||
| - = No Data Reported; -- = Not Applicable; NA = Not Available; W = Withheld to avoid disclosure of individual company data. |
| Release Date: 3/29/2024 |
| Next Release Date: 4/30/2024 |