|
Download Data (XLS File) |
|
||||||||
|
||||||||
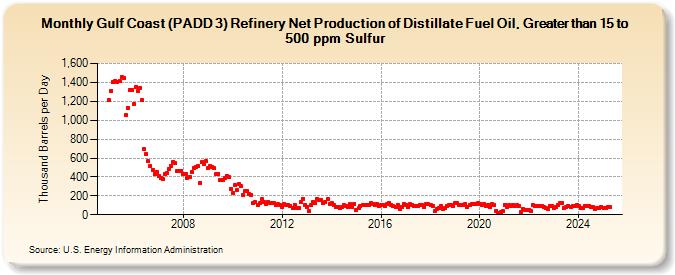
| Gulf Coast (PADD 3) Refinery Net Production of Distillate Fuel Oil, Greater than 15 to 500 ppm Sulfur (Thousand Barrels per Day) | ||||||||
| Year | Jan | Feb | Mar | Apr | May | Jun | Jul | Aug | Sep | Oct | Nov | Dec |
|---|---|---|---|---|---|---|---|---|---|---|---|---|
| 2005 | 1,209 | 1,313 | 1,409 | 1,418 | 1,402 | 1,412 | 1,457 | 1,450 | 1,054 | 1,134 | 1,324 | 1,323 |
| 2006 | 1,176 | 1,354 | 1,308 | 1,345 | 1,212 | 690 | 640 | 567 | 518 | 478 | 429 | 450 |
| 2007 | 410 | 389 | 382 | 430 | 438 | 487 | 519 | 559 | 542 | 459 | 463 | 464 |
| 2008 | 431 | 432 | 390 | 402 | 455 | 495 | 506 | 517 | 337 | 554 | 532 | 568 |
| 2009 | 493 | 517 | 509 | 490 | 435 | 434 | 366 | 365 | 390 | 410 | 395 | 277 |
| 2010 | 230 | 317 | 258 | 323 | 301 | 213 | 247 | 253 | 220 | 209 | 125 | 135 |
| 2011 | 106 | 119 | 161 | 130 | 113 | 137 | 128 | 125 | 119 | 103 | 110 | 98 |
| 2012 | 84 | 116 | 100 | 105 | 94 | 76 | 101 | 67 | 72 | 133 | 171 | 107 |
| 2013 | 84 | 37 | 99 | 132 | 127 | 171 | 152 | 154 | 120 | 137 | 165 | 115 |
| 2014 | 123 | 98 | 84 | 83 | 73 | 79 | 101 | 94 | 86 | 113 | 86 | 117 |
| 2015 | 54 | 66 | 87 | 99 | 99 | 99 | 106 | 120 | 117 | 101 | 117 | 91 |
| 2016 | 99 | 104 | 97 | 110 | 125 | 100 | 92 | 86 | 106 | 65 | 82 | 117 |
| 2017 | 101 | 80 | 109 | 105 | 97 | 93 | 95 | 105 | 100 | 83 | 114 | 109 |
| 2018 | 102 | 92 | 35 | 61 | 72 | 88 | 61 | 72 | 93 | 107 | 108 | 95 |
| 2019 | 119 | 119 | 106 | 102 | 108 | 113 | 81 | 103 | 111 | 113 | 115 | 121 |
| 2020 | 109 | 104 | 118 | 88 | 104 | 84 | 109 | 100 | 43 | 15 | 30 | 35 |
| 2021 | 103 | 80 | 100 | 95 | 106 | 92 | 106 | 91 | 30 | 63 | 45 | 52 |
| 2022 | 48 | 36 | 99 | 92 | 87 | 96 | 94 | 80 | 70 | 63 | 89 | 93 |
| 2023 | 75 | 80 | 99 | 123 | 129 | 76 | 80 | 96 | 85 | 93 | 88 | 106 |
| 2024 | 92 | 67 | 76 | 90 | 89 | 89 | ||||||
| - = No Data Reported; -- = Not Applicable; NA = Not Available; W = Withheld to avoid disclosure of individual company data. |
| Release Date: 8/30/2024 |
| Next Release Date: 9/30/2024 |