|
Download Data (XLS File) |
|
||||||||
|
||||||||
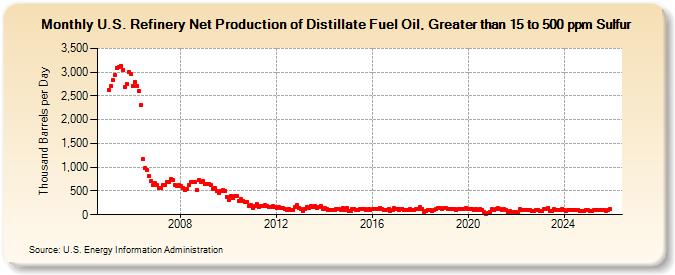
| U.S. Refinery Net Production of Distillate Fuel Oil, Greater than 15 to 500 ppm Sulfur (Thousand Barrels per Day) | ||||||||
| Year | Jan | Feb | Mar | Apr | May | Jun | Jul | Aug | Sep | Oct | Nov | Dec |
|---|---|---|---|---|---|---|---|---|---|---|---|---|
| 2005 | 2,615 | 2,712 | 2,842 | 2,938 | 3,079 | 3,100 | 3,138 | 3,052 | 2,694 | 2,758 | 3,005 | 2,965 |
| 2006 | 2,700 | 2,794 | 2,706 | 2,607 | 2,313 | 1,166 | 975 | 946 | 813 | 699 | 623 | 666 |
| 2007 | 618 | 567 | 560 | 615 | 627 | 689 | 697 | 742 | 720 | 624 | 613 | 625 |
| 2008 | 599 | 572 | 522 | 540 | 629 | 680 | 698 | 696 | 525 | 723 | 698 | 703 |
| 2009 | 640 | 656 | 650 | 630 | 550 | 569 | 503 | 462 | 507 | 512 | 492 | 379 |
| 2010 | 305 | 394 | 343 | 384 | 391 | 292 | 321 | 298 | 274 | 269 | 179 | 195 |
| 2011 | 150 | 176 | 234 | 168 | 184 | 186 | 197 | 175 | 161 | 163 | 175 | 154 |
| 2012 | 137 | 162 | 141 | 132 | 110 | 98 | 121 | 96 | 93 | 156 | 195 | 138 |
| 2013 | 112 | 70 | 130 | 155 | 135 | 187 | 172 | 179 | 134 | 157 | 184 | 128 |
| 2014 | 144 | 124 | 107 | 105 | 103 | 98 | 119 | 118 | 105 | 139 | 108 | 144 |
| 2015 | 70 | 82 | 110 | 121 | 100 | 100 | 126 | 130 | 128 | 104 | 123 | 101 |
| 2016 | 118 | 127 | 112 | 129 | 138 | 111 | 107 | 102 | 120 | 70 | 93 | 137 |
| 2017 | 119 | 100 | 124 | 129 | 103 | 95 | 105 | 117 | 106 | 95 | 129 | 126 |
| 2018 | 156 | 125 | 56 | 73 | 94 | 105 | 77 | 94 | 117 | 132 | 131 | 119 |
| 2019 | 144 | 140 | 125 | 123 | 120 | 125 | 93 | 119 | 116 | 128 | 127 | 144 |
| 2020 | 119 | 125 | 130 | 106 | 111 | 93 | 122 | 109 | 52 | 24 | 34 | 49 |
| 2021 | 111 | 90 | 115 | 133 | 123 | 100 | 120 | 97 | 41 | 71 | 60 | 67 |
| 2022 | 63 | 45 | 119 | 107 | 95 | 107 | 98 | 95 | 78 | 81 | 100 | 102 |
| 2023 | 88 | 88 | 118 | 126 | 149 | 79 | 86 | 110 | 94 | 101 | 100 | 123 |
| 2024 | 107 | 85 | ||||||||||
| - = No Data Reported; -- = Not Applicable; NA = Not Available; W = Withheld to avoid disclosure of individual company data. |
| Release Date: 4/30/2024 |
| Next Release Date: 5/31/2024 |