|
Download Data (XLS File) |
|
||||||||
|
||||||||
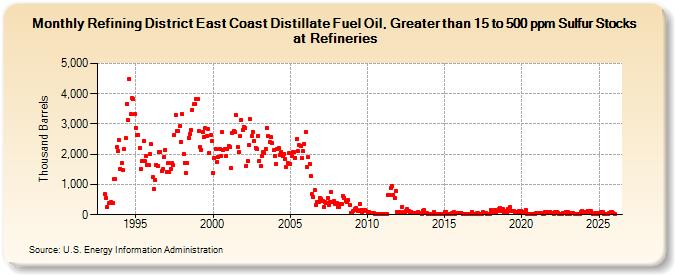
| Refining District East Coast Distillate Fuel Oil, Greater than 15 to 500 ppm Sulfur Stocks at Refineries (Thousand Barrels) | ||||||||
| Year | Jan | Feb | Mar | Apr | May | Jun | Jul | Aug | Sep | Oct | Nov | Dec |
|---|---|---|---|---|---|---|---|---|---|---|---|---|
| 1993 | 675 | 557 | 244 | 373 | 378 | 413 | 402 | 1,165 | 1,183 | 2,223 | 2,114 | 2,475 |
| 1994 | 1,515 | 1,711 | 1,478 | 2,163 | 2,529 | 3,668 | 3,125 | 4,486 | 3,317 | 3,867 | 3,832 | 3,330 |
| 1995 | 2,873 | 2,629 | 2,648 | 2,209 | 1,507 | 1,784 | 2,431 | 1,769 | 1,945 | 1,637 | 1,656 | 2,003 |
| 1996 | 2,329 | 1,235 | 856 | 1,149 | 1,654 | 1,611 | 2,069 | 2,081 | 1,431 | 1,511 | 1,910 | 2,145 |
| 1997 | 1,419 | 1,712 | 1,412 | 1,499 | 1,712 | 1,638 | 2,647 | 3,293 | 2,771 | 2,757 | 2,939 | 2,408 |
| 1998 | 3,327 | 2,001 | 1,723 | 1,377 | 1,706 | 2,550 | 2,668 | 2,808 | 3,477 | 3,649 | 3,671 | 3,835 |
| 1999 | 3,818 | 2,779 | 2,238 | 2,154 | 2,736 | 2,584 | 2,860 | 2,589 | 2,838 | 2,056 | 2,626 | 2,428 |
| 2000 | 1,377 | 1,872 | 2,181 | 1,742 | 1,910 | 2,188 | 1,934 | 2,731 | 2,134 | 2,161 | 1,930 | 2,184 |
| 2001 | 2,276 | 2,239 | 1,552 | 2,700 | 2,757 | 2,719 | 3,285 | 2,250 | 2,081 | 2,586 | 3,134 | 2,807 |
| 2002 | 2,915 | 2,865 | 1,624 | 1,780 | 2,307 | 3,162 | 2,596 | 2,746 | 2,448 | 2,217 | 2,162 | 2,618 |
| 2003 | 1,785 | 1,598 | 1,935 | 2,078 | 2,047 | 2,186 | 2,869 | 2,591 | 2,415 | 2,561 | 2,385 | 2,137 |
| 2004 | 1,939 | 1,667 | 2,187 | 2,204 | 1,971 | 2,080 | 1,926 | 2,022 | 1,838 | 1,574 | 1,725 | 2,024 |
| 2005 | 1,679 | 1,945 | 2,071 | 2,060 | 1,879 | 2,510 | 2,100 | 2,304 | 2,263 | 1,888 | 2,104 | 2,331 |
| 2006 | 2,745 | 1,589 | 1,904 | 1,670 | 1,273 | 670 | 585 | 808 | 318 | 426 | 416 | 560 |
| 2007 | 532 | 437 | 250 | 435 | 402 | 554 | 328 | 419 | 737 | 430 | 469 | 361 |
| 2008 | 381 | 271 | 259 | 356 | 363 | 614 | 564 | 440 | 424 | 474 | 332 | 72 |
| 2009 | 42 | 125 | 178 | 220 | 143 | 115 | 363 | 146 | 49 | 154 | 156 | 121 |
| 2010 | 87 | 91 | 43 | 57 | 51 | 41 | 25 | 40 | 27 | 35 | 36 | 36 |
| 2011 | 36 | 29 | 24 | 27 | 648 | 662 | 892 | 963 | 652 | 559 | 778 | 100 |
| 2012 | 61 | 88 | 71 | 266 | 90 | 96 | 130 | 177 | 107 | 64 | 102 | 53 |
| 2013 | 42 | 43 | 62 | 79 | 59 | 70 | 27 | 136 | 155 | 69 | 55 | 38 |
| 2014 | 23 | 31 | 23 | 27 | 84 | 23 | 33 | 25 | 40 | 22 | 21 | 38 |
| 2015 | 82 | 95 | 32 | 36 | 37 | 27 | 51 | 81 | 40 | 41 | 54 | 67 |
| 2016 | 45 | 69 | 29 | 29 | 26 | 26 | 38 | 33 | 30 | 90 | 34 | 28 |
| 2017 | 28 | 42 | 48 | 34 | 39 | 32 | 76 | 44 | 51 | 29 | 33 | 29 |
| 2018 | 166 | 133 | 100 | 169 | 44 | 135 | 184 | 213 | 130 | 177 | 72 | 132 |
| 2019 | 102 | 179 | 114 | 247 | 132 | 137 | 108 | 102 | 103 | 104 | 109 | 132 |
| 2020 | 54 | 105 | 79 | 161 | 28 | 25 | 25 | 25 | 33 | 30 | 25 | 60 |
| 2021 | 42 | 43 | 54 | 59 | 34 | 37 | 78 | 53 | 80 | 54 | 92 | 42 |
| 2022 | 46 | 26 | 76 | 88 | 73 | 31 | 36 | 24 | 57 | 59 | 99 | 35 |
| 2023 | 74 | 33 | 43 | 59 | 44 | 26 | 31 | 27 | 24 | 40 | 90 | 119 |
| 2024 | 71 | |||||||||||
| - = No Data Reported; -- = Not Applicable; NA = Not Available; W = Withheld to avoid disclosure of individual company data. |
| Release Date: 3/29/2024 |
| Next Release Date: 4/30/2024 |