|
Download Data (XLS File) |
|
||||||||
|
||||||||
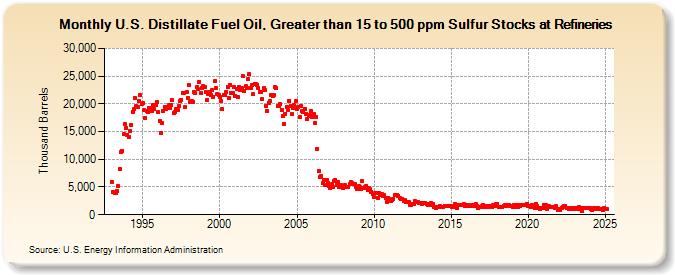
| U.S. Distillate Fuel Oil, Greater than 15 to 500 ppm Sulfur Stocks at Refineries (Thousand Barrels) | ||||||||
| Year | Jan | Feb | Mar | Apr | May | Jun | Jul | Aug | Sep | Oct | Nov | Dec |
|---|---|---|---|---|---|---|---|---|---|---|---|---|
| 1993 | 5,976 | 4,055 | 3,922 | 3,988 | 4,339 | 5,173 | 8,248 | 11,310 | 11,570 | 14,494 | 16,296 | 15,730 |
| 1994 | 14,402 | 14,053 | 15,100 | 16,264 | 18,593 | 19,071 | 21,069 | 19,601 | 19,518 | 20,497 | 21,513 | 20,059 |
| 1995 | 20,124 | 18,827 | 17,421 | 18,716 | 18,446 | 19,336 | 19,092 | 18,733 | 19,756 | 18,988 | 19,856 | 20,258 |
| 1996 | 18,462 | 16,853 | 14,770 | 16,517 | 18,665 | 19,470 | 19,025 | 19,501 | 19,754 | 19,236 | 19,744 | 20,649 |
| 1997 | 18,289 | 18,606 | 19,150 | 18,901 | 19,541 | 20,495 | 20,780 | 21,994 | 21,892 | 19,387 | 22,099 | 21,089 |
| 1998 | 23,374 | 20,377 | 20,598 | 20,274 | 22,078 | 21,923 | 22,954 | 22,614 | 23,985 | 21,877 | 22,820 | 23,191 |
| 1999 | 23,046 | 22,153 | 20,774 | 21,753 | 22,151 | 21,592 | 22,424 | 21,300 | 24,030 | 22,886 | 21,812 | 21,540 |
| 2000 | 21,291 | 20,575 | 19,020 | 21,658 | 21,505 | 22,207 | 23,067 | 21,135 | 23,406 | 21,978 | 21,966 | 23,018 |
| 2001 | 21,365 | 22,630 | 21,294 | 23,002 | 22,439 | 22,785 | 24,952 | 22,282 | 23,158 | 22,914 | 24,446 | 25,294 |
| 2002 | 22,883 | 23,427 | 21,722 | 23,577 | 23,578 | 23,427 | 22,880 | 22,222 | 22,204 | 20,911 | 22,827 | 22,561 |
| 2003 | 19,667 | 18,648 | 20,152 | 20,499 | 21,510 | 21,460 | 21,563 | 23,006 | 22,796 | 19,652 | 19,691 | 19,969 |
| 2004 | 18,951 | 17,828 | 16,431 | 18,212 | 19,435 | 18,929 | 20,559 | 19,588 | 18,106 | 19,190 | 19,704 | 20,462 |
| 2005 | 19,038 | 19,496 | 17,664 | 19,610 | 18,636 | 18,592 | 19,157 | 18,242 | 17,283 | 17,860 | 18,037 | 18,728 |
| 2006 | 17,692 | 18,102 | 16,577 | 17,655 | 11,878 | 7,866 | 6,713 | 6,938 | 5,634 | 6,268 | 5,389 | 6,223 |
| 2007 | 5,712 | 5,194 | 4,811 | 5,454 | 4,970 | 6,031 | 6,272 | 5,433 | 5,990 | 5,074 | 5,341 | 5,193 |
| 2008 | 4,823 | 5,337 | 4,947 | 4,979 | 4,975 | 5,559 | 5,927 | 5,672 | 5,586 | 5,470 | 5,038 | 4,608 |
| 2009 | 5,136 | 4,946 | 4,618 | 6,008 | 4,884 | 4,963 | 5,194 | 4,520 | 4,902 | 4,562 | 4,150 | 3,799 |
| 2010 | 3,131 | 3,832 | 3,904 | 3,082 | 3,843 | 3,615 | 3,790 | 3,298 | 3,495 | 3,062 | 2,374 | 3,032 |
| 2011 | 2,797 | 2,514 | 2,644 | 2,906 | 3,642 | 3,526 | 3,503 | 3,448 | 2,978 | 2,860 | 2,878 | 2,521 |
| 2012 | 2,614 | 2,356 | 2,273 | 2,238 | 1,820 | 1,795 | 2,005 | 2,010 | 2,440 | 2,224 | 2,253 | 2,140 |
| 2013 | 2,144 | 1,996 | 2,088 | 2,083 | 2,157 | 1,950 | 1,810 | 1,973 | 2,062 | 1,675 | 1,966 | 1,306 |
| 2014 | 1,229 | 1,407 | 1,461 | 1,566 | 1,432 | 1,311 | 1,456 | 1,582 | 1,532 | 1,498 | 1,662 | 1,579 |
| 2015 | 1,595 | 1,370 | 1,315 | 1,990 | 1,789 | 1,231 | 1,723 | 1,705 | 1,827 | 1,770 | 1,863 | 1,538 |
| 2016 | 1,801 | 1,639 | 1,685 | 1,574 | 1,534 | 1,767 | 1,555 | 1,962 | 1,640 | 1,205 | 1,394 | 1,408 |
| 2017 | 1,503 | 1,798 | 1,421 | 1,566 | 1,550 | 1,477 | 1,517 | 1,629 | 1,315 | 1,682 | 1,499 | 1,909 |
| 2018 | 1,987 | 1,446 | 1,324 | 1,442 | 1,359 | 1,640 | 1,749 | 1,643 | 1,706 | 1,746 | 1,599 | 1,653 |
| 2019 | 1,353 | 1,751 | 1,473 | 1,668 | 1,457 | 1,713 | 1,527 | 1,821 | 1,697 | 1,690 | 1,807 | 1,962 |
| 2020 | 1,559 | 1,622 | 1,441 | 1,837 | 1,340 | 1,173 | 1,994 | 1,581 | 1,285 | 985 | 1,254 | 1,258 |
| 2021 | 1,814 | 1,237 | 1,727 | 1,085 | 1,488 | 1,445 | 1,454 | 1,340 | 1,401 | 1,196 | 1,491 | 782 |
| 2022 | 1,000 | 858 | 1,301 | 1,426 | 1,530 | 1,556 | 1,265 | 1,223 | 1,005 | 1,183 | 1,291 | 1,055 |
| 2023 | 1,191 | 1,040 | 1,228 | 1,024 | 1,379 | 1,230 | 736 | 1,182 | 1,233 | 1,258 | 1,128 | 1,237 |
| 2024 | 1,232 | 945 | 857 | 1,212 | ||||||||
| - = No Data Reported; -- = Not Applicable; NA = Not Available; W = Withheld to avoid disclosure of individual company data. |
| Release Date: 6/28/2024 |
| Next Release Date: 7/31/2024 |