|
Download Data (XLS File) |
|
||||||||
|
||||||||
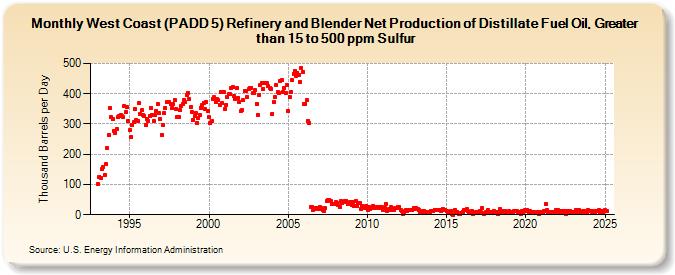
| West Coast (PADD 5) Refinery and Blender Net Production of Distillate Fuel Oil, Greater than 15 to 500 ppm Sulfur (Thousand Barrels per Day) | ||||||||
| Year | Jan | Feb | Mar | Apr | May | Jun | Jul | Aug | Sep | Oct | Nov | Dec |
|---|---|---|---|---|---|---|---|---|---|---|---|---|
| 1993 | 102 | 126 | 123 | 151 | 157 | 132 | 167 | 219 | 263 | 353 | 323 | 316 |
| 1994 | 278 | 271 | 283 | 323 | 325 | 331 | 325 | 323 | 359 | 339 | 356 | 310 |
| 1995 | 279 | 258 | 296 | 306 | 348 | 313 | 311 | 368 | 334 | 346 | 331 | 327 |
| 1996 | 295 | 316 | 310 | 326 | 353 | 330 | 309 | 329 | 343 | 366 | 335 | 318 |
| 1997 | 264 | 297 | 336 | 353 | 371 | 374 | 371 | 367 | 352 | 365 | 380 | 350 |
| 1998 | 322 | 323 | 346 | 361 | 366 | 379 | 372 | 395 | 404 | 383 | 355 | 341 |
| 1999 | 313 | 325 | 337 | 304 | 321 | 330 | 354 | 364 | 369 | 349 | 372 | 342 |
| 2000 | 322 | 302 | 309 | 383 | 388 | 372 | 382 | 379 | 364 | 405 | 370 | 407 |
| 2001 | 351 | 364 | 390 | 398 | 398 | 420 | 422 | 392 | 383 | 418 | 387 | 373 |
| 2002 | 342 | 345 | 378 | 410 | 410 | 390 | 415 | 420 | 420 | 403 | 401 | 411 |
| 2003 | 367 | 330 | 395 | 430 | 436 | 417 | 435 | 436 | 434 | 424 | 419 | 417 |
| 2004 | 334 | 371 | 390 | 429 | 407 | 403 | 441 | 445 | 406 | 420 | 403 | 429 |
| 2005 | 342 | 388 | 407 | 446 | 466 | 475 | 459 | 470 | 463 | 439 | 486 | 473 |
| 2006 | 366 | 367 | 378 | 311 | 304 | 27 | 27 | 17 | 19 | 23 | 21 | 18 |
| 2007 | 26 | 23 | 14 | 13 | 21 | 46 | 47 | 50 | 45 | 36 | 37 | 34 |
| 2008 | 41 | 39 | 31 | 25 | 46 | 40 | 43 | 45 | 46 | 37 | 38 | 42 |
| 2009 | 31 | 41 | 30 | 45 | 30 | 39 | 38 | 20 | 28 | 24 | 21 | 29 |
| 2010 | 17 | 26 | 18 | 22 | 28 | 24 | 23 | 24 | 24 | 21 | 25 | 24 |
| 2011 | 15 | 23 | 37 | 13 | 18 | 15 | 24 | 19 | 16 | 23 | 23 | 26 |
| 2012 | 27 | 15 | 11 | 3 | 9 | 15 | 12 | 17 | 14 | 16 | 17 | 23 |
| 2013 | 20 | 22 | 20 | 17 | 8 | 7 | 13 | 13 | 9 | 6 | 8 | 8 |
| 2014 | 11 | 12 | 13 | 17 | 17 | 14 | 15 | 14 | 11 | 19 | 15 | 17 |
| 2015 | 11 | 8 | 10 | 11 | 1 | 0 | 15 | 10 | 10 | 3 | 1 | 7 |
| 2016 | 10 | 17 | 14 | 18 | 11 | 9 | 10 | 11 | 1 | 5 | 8 | 10 |
| 2017 | 8 | 11 | 8 | 22 | 4 | 6 | 10 | 15 | 5 | 10 | 10 | 10 |
| 2018 | 12 | 10 | 10 | 3 | 18 | 8 | 5 | 13 | 12 | 7 | 10 | 11 |
| 2019 | 10 | 10 | 10 | 12 | 11 | 11 | 10 | 9 | 1 | 12 | 9 | 15 |
| 2020 | 12 | 16 | 9 | 11 | 9 | 9 | 9 | 7 | 6 | 9 | 1 | 10 |
| 2021 | 9 | 7 | 11 | 35 | 15 | 7 | 9 | 7 | 8 | 8 | 8 | 16 |
| 2022 | 14 | 10 | 13 | 13 | 8 | 11 | 3 | 12 | 6 | 13 | 9 | 10 |
| 2023 | 8 | 10 | 15 | 6 | 16 | 8 | 8 | 11 | 12 | 8 | 9 | 14 |
| 2024 | 11 | |||||||||||
| - = No Data Reported; -- = Not Applicable; NA = Not Available; W = Withheld to avoid disclosure of individual company data. |
| Release Date: 3/29/2024 |
| Next Release Date: 4/30/2024 |