|
Download Data (XLS File) |
|
||||||||
|
||||||||
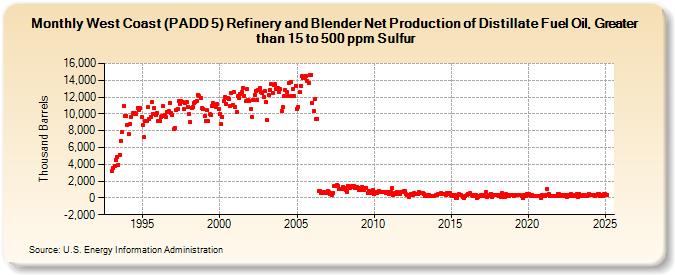
| West Coast (PADD 5) Refinery and Blender Net Production of Distillate Fuel Oil, Greater than 15 to 500 ppm Sulfur (Thousand Barrels) | ||||||||
| Year | Jan | Feb | Mar | Apr | May | Jun | Jul | Aug | Sep | Oct | Nov | Dec |
|---|---|---|---|---|---|---|---|---|---|---|---|---|
| 1993 | 3,169 | 3,525 | 3,828 | 4,527 | 4,860 | 3,950 | 5,163 | 6,792 | 7,882 | 10,958 | 9,690 | 9,800 |
| 1994 | 8,625 | 7,590 | 8,761 | 9,687 | 10,087 | 9,942 | 10,066 | 10,017 | 10,760 | 10,511 | 10,679 | 9,598 |
| 1995 | 8,650 | 7,218 | 9,169 | 9,178 | 10,773 | 9,379 | 9,639 | 11,399 | 10,028 | 10,735 | 9,919 | 10,130 |
| 1996 | 9,140 | 9,161 | 9,595 | 9,765 | 10,934 | 9,896 | 9,578 | 10,213 | 10,287 | 11,344 | 10,056 | 9,861 |
| 1997 | 8,170 | 8,325 | 10,413 | 10,601 | 11,497 | 11,226 | 11,499 | 11,373 | 10,553 | 11,302 | 11,409 | 10,847 |
| 1998 | 9,982 | 9,038 | 10,716 | 10,816 | 11,348 | 11,381 | 11,526 | 12,252 | 12,107 | 11,872 | 10,655 | 10,559 |
| 1999 | 9,710 | 9,108 | 10,455 | 9,121 | 9,939 | 9,905 | 10,965 | 11,289 | 11,064 | 10,805 | 11,167 | 10,597 |
| 2000 | 9,988 | 8,753 | 9,572 | 11,496 | 12,038 | 11,171 | 11,853 | 11,744 | 10,907 | 12,540 | 11,098 | 12,628 |
| 2001 | 10,866 | 10,193 | 12,085 | 11,927 | 12,340 | 12,599 | 13,096 | 12,139 | 11,495 | 12,947 | 11,616 | 11,570 |
| 2002 | 10,596 | 9,664 | 11,703 | 12,305 | 12,719 | 11,712 | 12,876 | 13,031 | 12,596 | 12,487 | 12,019 | 12,735 |
| 2003 | 11,368 | 9,237 | 12,232 | 12,898 | 13,528 | 12,497 | 13,487 | 13,512 | 13,019 | 13,131 | 12,571 | 12,927 |
| 2004 | 10,350 | 10,768 | 12,099 | 12,864 | 12,622 | 12,085 | 13,659 | 13,794 | 12,187 | 13,018 | 12,097 | 13,292 |
| 2005 | 10,601 | 10,861 | 12,628 | 13,378 | 14,454 | 14,262 | 14,222 | 14,563 | 13,877 | 13,623 | 14,576 | 14,666 |
| 2006 | 11,331 | 10,287 | 11,717 | 9,333 | 9,411 | 812 | 828 | 532 | 581 | 714 | 639 | 553 |
| 2007 | 811 | 646 | 446 | 396 | 636 | 1,382 | 1,446 | 1,536 | 1,363 | 1,103 | 1,114 | 1,060 |
| 2008 | 1,261 | 1,144 | 969 | 747 | 1,435 | 1,187 | 1,334 | 1,391 | 1,366 | 1,139 | 1,150 | 1,292 |
| 2009 | 948 | 1,141 | 936 | 1,350 | 933 | 1,178 | 1,191 | 620 | 852 | 729 | 627 | 893 |
| 2010 | 524 | 741 | 543 | 660 | 865 | 708 | 702 | 755 | 727 | 639 | 737 | 748 |
| 2011 | 459 | 655 | 1,142 | 380 | 567 | 458 | 758 | 589 | 492 | 722 | 684 | 810 |
| 2012 | 837 | 421 | 355 | 98 | 290 | 437 | 380 | 534 | 428 | 490 | 495 | 725 |
| 2013 | 608 | 626 | 613 | 502 | 233 | 215 | 390 | 398 | 276 | 201 | 226 | 241 |
| 2014 | 332 | 325 | 412 | 513 | 530 | 414 | 451 | 427 | 344 | 585 | 453 | 525 |
| 2015 | 331 | 210 | 322 | 317 | 20 | -1 | 452 | 304 | 304 | 83 | 30 | 203 |
| 2016 | 306 | 483 | 427 | 530 | 335 | 257 | 296 | 343 | 25 | 142 | 239 | 312 |
| 2017 | 252 | 315 | 234 | 661 | 121 | 169 | 315 | 478 | 157 | 318 | 293 | 296 |
| 2018 | 384 | 269 | 316 | 104 | 553 | 244 | 143 | 416 | 354 | 229 | 297 | 347 |
| 2019 | 323 | 273 | 311 | 351 | 348 | 334 | 308 | 281 | 25 | 369 | 260 | 474 |
| 2020 | 357 | 474 | 273 | 323 | 274 | 284 | 285 | 232 | 187 | 268 | 30 | 295 |
| 2021 | 273 | 205 | 355 | 1,050 | 455 | 214 | 278 | 221 | 254 | 253 | 253 | 508 |
| 2022 | 422 | 286 | 388 | 377 | 253 | 330 | 107 | 359 | 191 | 409 | 284 | 308 |
| 2023 | 258 | 274 | 459 | 166 | 505 | 231 | 247 | 351 | 350 | 251 | 282 | 449 |
| 2024 | 333 | 305 | 304 | 333 | ||||||||
| - = No Data Reported; -- = Not Applicable; NA = Not Available; W = Withheld to avoid disclosure of individual company data. |
| Release Date: 6/28/2024 |
| Next Release Date: 7/31/2024 |