|
Download Data (XLS File) |
|
||||||||
|
||||||||
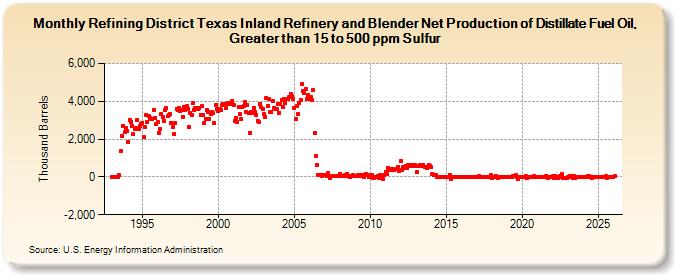
| Refining District Texas Inland Refinery and Blender Net Production of Distillate Fuel Oil, Greater than 15 to 500 ppm Sulfur (Thousand Barrels) | ||||||||
| Year | Jan | Feb | Mar | Apr | May | Jun | Jul | Aug | Sep | Oct | Nov | Dec |
|---|---|---|---|---|---|---|---|---|---|---|---|---|
| 1993 | 8 | 7 | 8 | 16 | 16 | 11 | 75 | 1,354 | 2,157 | 2,710 | 2,356 | 2,571 |
| 1994 | 2,426 | 1,850 | 3,018 | 2,917 | 2,700 | 2,262 | 2,554 | 2,563 | 3,000 | 2,534 | 2,696 | 2,786 |
| 1995 | 2,858 | 2,097 | 2,649 | 3,299 | 2,923 | 3,233 | 3,091 | 3,047 | 3,053 | 3,555 | 3,118 | 2,785 |
| 1996 | 2,920 | 2,314 | 2,520 | 3,336 | 3,175 | 2,974 | 3,526 | 3,649 | 3,201 | 3,257 | 3,338 | 2,849 |
| 1997 | 2,619 | 2,291 | 2,829 | 3,615 | 3,523 | 3,645 | 3,484 | 3,564 | 3,195 | 3,716 | 3,535 | 3,732 |
| 1998 | 3,587 | 2,663 | 3,381 | 3,254 | 3,896 | 3,541 | 3,638 | 3,627 | 3,595 | 3,624 | 3,278 | 3,762 |
| 1999 | 3,263 | 2,841 | 3,071 | 3,552 | 3,449 | 3,063 | 3,317 | 3,422 | 3,381 | 2,846 | 3,815 | 3,570 |
| 2000 | 3,463 | 3,616 | 3,537 | 3,822 | 3,877 | 3,858 | 3,627 | 3,856 | 3,897 | 3,875 | 3,835 | 3,996 |
| 2001 | 3,826 | 2,982 | 3,140 | 2,893 | 3,706 | 3,320 | 3,056 | 3,697 | 3,760 | 3,946 | 3,444 | 3,792 |
| 2002 | 3,364 | 2,343 | 3,431 | 3,402 | 3,658 | 3,433 | 3,296 | 2,959 | 2,917 | 3,848 | 3,675 | 3,573 |
| 2003 | 3,354 | 3,171 | 4,178 | 3,773 | 4,107 | 3,426 | 3,418 | 4,016 | 3,668 | 3,587 | 3,581 | 3,835 |
| 2004 | 3,402 | 3,845 | 4,077 | 3,708 | 4,095 | 3,924 | 4,107 | 4,142 | 4,220 | 4,400 | 4,269 | 4,113 |
| 2005 | 3,626 | 3,047 | 3,731 | 3,339 | 3,912 | 4,071 | 4,892 | 4,520 | 4,438 | 4,659 | 4,142 | 4,335 |
| 2006 | 4,101 | 4,204 | 4,089 | 4,571 | 2,314 | 1,081 | 639 | 113 | 103 | 113 | 43 | 114 |
| 2007 | 102 | 90 | 73 | 196 | -39 | 50 | 71 | 50 | 54 | 70 | 65 | 73 |
| 2008 | 178 | 73 | 74 | 66 | 84 | 73 | 174 | 74 | 20 | 70 | 77 | 74 |
| 2009 | 27 | 61 | 84 | 55 | 35 | 117 | 76 | 9 | 79 | 145 | 107 | -24 |
| 2010 | 34 | 124 | -45 | -35 | 4 | -30 | 30 | -40 | 94 | 13 | -112 | 78 |
| 2011 | 268 | 140 | 471 | 390 | 405 | 438 | 362 | 387 | 398 | 399 | 541 | 314 |
| 2012 | 844 | 388 | 515 | 497 | 580 | 453 | 652 | 557 | 640 | 647 | 580 | 639 |
| 2013 | 584 | 236 | 573 | 616 | 639 | 564 | 621 | 532 | 519 | 494 | 604 | 577 |
| 2014 | 515 | 138 | 81 | 113 | 89 | 20 | -1 | -1 | -15 | 12 | -15 | 1 |
| 2015 | -1 | 2 | 11 | 112 | -100 | -12 | -10 | 7 | 1 | 15 | -23 | |
| 2016 | -3 | 12 | -3 | 4 | 2 | -7 | -7 | 7 | -5 | 2 | 9 | -6 |
| 2017 | -5 | 25 | -9 | 2 | -8 | -3 | 7 | 1 | 14 | -22 | 79 | |
| 2018 | -77 | -4 | 4 | 55 | -21 | -38 | 10 | -12 | -3 | 21 | 5 | |
| 2019 | -24 | -3 | 6 | 20 | -6 | 27 | 89 | -26 | -102 | -5 | 21 | |
| 2020 | -9 | 7 | 23 | -35 | 6 | 17 | -28 | -4 | 23 | -21 | 17 | |
| 2021 | -20 | 14 | -12 | 8 | -8 | 15 | -15 | 53 | -43 | -5 | 12 | -7 |
| 2022 | 39 | -43 | 24 | 15 | -34 | -7 | 56 | 139 | -46 | -50 | -44 | -57 |
| 2023 | 2 | 2 | 26 | 63 | -71 | 48 | -63 | 10 | -19 | 6 | -1 | -1 |
| 2024 | -3 | |||||||||||
| - = No Data Reported; -- = Not Applicable; NA = Not Available; W = Withheld to avoid disclosure of individual company data. |
| Release Date: 3/29/2024 |
| Next Release Date: 4/30/2024 |