|
Download Data (XLS File) |
|
||||||||
|
||||||||
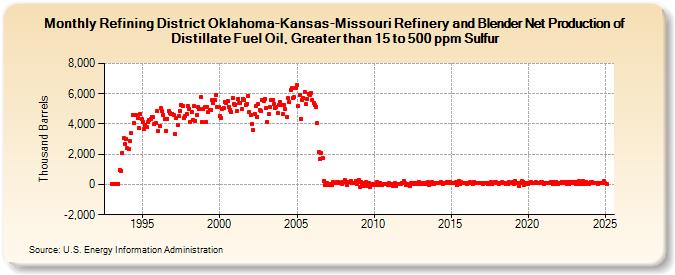
| Refining District Oklahoma-Kansas-Missouri Refinery and Blender Net Production of Distillate Fuel Oil, Greater than 15 to 500 ppm Sulfur (Thousand Barrels) | ||||||||
| Year | Jan | Feb | Mar | Apr | May | Jun | Jul | Aug | Sep | Oct | Nov | Dec |
|---|---|---|---|---|---|---|---|---|---|---|---|---|
| 1993 | 24 | 30 | 24 | 21 | 38 | 38 | 985 | 912 | 2,099 | 3,056 | 2,682 | 3,020 |
| 1994 | 2,393 | 2,351 | 2,860 | 3,383 | 4,626 | 4,053 | 4,591 | 4,569 | 4,381 | 3,704 | 4,649 | 4,329 |
| 1995 | 4,149 | 3,635 | 3,957 | 3,795 | 4,102 | 4,253 | 4,329 | 4,489 | 4,464 | 4,031 | 4,068 | 4,832 |
| 1996 | 3,509 | 3,859 | 5,038 | 4,840 | 4,619 | 4,350 | 3,554 | 4,348 | 4,825 | 4,693 | 4,675 | 4,682 |
| 1997 | 4,619 | 3,334 | 4,412 | 3,949 | 4,498 | 4,825 | 5,277 | 5,201 | 4,426 | 4,510 | 4,692 | 5,216 |
| 1998 | 5,017 | 4,148 | 4,791 | 4,270 | 5,163 | 4,195 | 4,591 | 5,136 | 5,021 | 5,768 | 4,120 | 4,978 |
| 1999 | 5,090 | 4,158 | 5,113 | 4,764 | 4,943 | 4,928 | 5,577 | 5,361 | 5,564 | 5,883 | 5,128 | 5,090 |
| 2000 | 4,560 | 4,405 | 4,983 | 5,056 | 5,482 | 5,380 | 5,490 | 5,139 | 4,949 | 4,771 | 5,749 | 5,316 |
| 2001 | 5,281 | 4,839 | 5,683 | 5,405 | 5,407 | 4,963 | 5,670 | 5,588 | 5,257 | 5,336 | 5,866 | 4,780 |
| 2002 | 4,614 | 4,007 | 3,598 | 4,658 | 5,180 | 4,487 | 5,326 | 4,900 | 4,870 | 5,584 | 5,523 | 5,649 |
| 2003 | 5,072 | 4,138 | 4,644 | 5,127 | 5,564 | 5,589 | 5,317 | 5,050 | 5,100 | 4,706 | 5,232 | 5,480 |
| 2004 | 5,266 | 4,630 | 5,287 | 5,015 | 4,466 | 5,689 | 5,422 | 6,225 | 6,367 | 5,746 | 5,758 | 6,403 |
| 2005 | 6,575 | 5,195 | 5,889 | 4,320 | 5,603 | 5,726 | 6,094 | 5,311 | 5,660 | 5,999 | 5,919 | 6,039 |
| 2006 | 5,570 | 5,370 | 5,227 | 5,140 | 4,043 | 2,121 | 1,676 | 2,078 | 1,767 | 249 | -36 | 88 |
| 2007 | -35 | 60 | -13 | -56 | 158 | 73 | 122 | 190 | 83 | 136 | 75 | 2 |
| 2008 | 183 | 290 | 145 | -3 | 136 | 145 | 255 | 114 | 93 | 119 | 235 | 22 |
| 2009 | 306 | -139 | 164 | 92 | -87 | 12 | 151 | -115 | 73 | -142 | -5 | 38 |
| 2010 | 8 | -14 | 138 | -64 | -10 | 101 | -45 | 62 | 14 | 27 | 8 | -21 |
| 2011 | 70 | -58 | 55 | -75 | 95 | -84 | 50 | 6 | 43 | 18 | 84 | 212 |
| 2012 | 67 | -53 | 16 | -13 | -83 | 128 | 40 | 123 | 29 | 99 | 58 | 133 |
| 2013 | 83 | 30 | 103 | 48 | 88 | 56 | 139 | -18 | 45 | 139 | 124 | 42 |
| 2014 | 94 | 97 | 126 | 96 | 158 | 108 | 50 | 111 | 77 | 135 | 76 | 163 |
| 2015 | 85 | 107 | 126 | 92 | 143 | -14 | 211 | 16 | 135 | 96 | 101 | 113 |
| 2016 | 49 | 115 | 79 | 138 | 108 | 61 | 195 | 87 | 98 | 84 | 92 | 84 |
| 2017 | 113 | 47 | 89 | 93 | 127 | 28 | 114 | 148 | 23 | 121 | 138 | 138 |
| 2018 | 84 | 59 | 83 | 72 | 160 | 116 | 117 | 56 | 48 | 155 | 93 | 68 |
| 2019 | 139 | 50 | 230 | 97 | 100 | -108 | 116 | 200 | 152 | -41 | 127 | 115 |
| 2020 | 4 | 127 | 140 | 124 | 117 | 93 | 160 | 98 | 86 | 88 | 165 | 139 |
| 2021 | 37 | 66 | 96 | 110 | 105 | 103 | 151 | 57 | 142 | 38 | 195 | 59 |
| 2022 | 129 | 82 | 189 | 104 | 93 | 136 | 45 | 185 | 43 | 190 | 73 | 95 |
| 2023 | 132 | 30 | 182 | 8 | 224 | -1 | 60 | 235 | 37 | 195 | 130 | 21 |
| 2024 | 118 | 145 | 169 | 102 | ||||||||
| - = No Data Reported; -- = Not Applicable; NA = Not Available; W = Withheld to avoid disclosure of individual company data. |
| Release Date: 6/28/2024 |
| Next Release Date: 7/31/2024 |