|
Download Data (XLS File) |
|
||||||||
|
||||||||
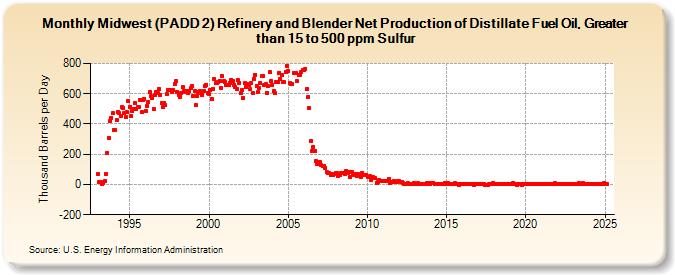
| Midwest (PADD 2) Refinery and Blender Net Production of Distillate Fuel Oil, Greater than 15 to 500 ppm Sulfur (Thousand Barrels per Day) | ||||||||
| Year | Jan | Feb | Mar | Apr | May | Jun | Jul | Aug | Sep | Oct | Nov | Dec |
|---|---|---|---|---|---|---|---|---|---|---|---|---|
| 1993 | 71 | 18 | 14 | 3 | 7 | 24 | 70 | 205 | 306 | 422 | 440 | 470 |
| 1994 | 362 | 358 | 424 | 482 | 472 | 454 | 511 | 507 | 475 | 446 | 477 | 550 |
| 1995 | 513 | 455 | 487 | 502 | 539 | 502 | 513 | 514 | 561 | 479 | 558 | 567 |
| 1996 | 488 | 520 | 544 | 611 | 583 | 571 | 499 | 589 | 614 | 605 | 633 | 592 |
| 1997 | 537 | 509 | 541 | 524 | 598 | 626 | 625 | 625 | 612 | 624 | 665 | 685 |
| 1998 | 610 | 590 | 581 | 605 | 642 | 621 | 610 | 618 | 608 | 618 | 635 | 654 |
| 1999 | 586 | 616 | 523 | 585 | 613 | 616 | 604 | 590 | 618 | 651 | 660 | 605 |
| 2000 | 595 | 623 | 567 | 628 | 697 | 668 | 673 | 677 | 686 | 640 | 715 | 682 |
| 2001 | 677 | 660 | 658 | 660 | 670 | 692 | 681 | 657 | 645 | 634 | 690 | 672 |
| 2002 | 603 | 627 | 575 | 669 | 646 | 663 | 657 | 629 | 670 | 608 | 695 | 725 |
| 2003 | 651 | 610 | 640 | 671 | 717 | 720 | 661 | 662 | 607 | 649 | 743 | 681 |
| 2004 | 660 | 618 | 602 | 676 | 676 | 740 | 697 | 722 | 676 | 676 | 745 | 784 |
| 2005 | 749 | 670 | 666 | 664 | 737 | 736 | 737 | 682 | 723 | 727 | 746 | 760 |
| 2006 | 756 | 766 | 631 | 580 | 505 | 285 | 218 | 249 | 219 | 152 | 136 | 148 |
| 2007 | 146 | 126 | 122 | 119 | 112 | 84 | 78 | 75 | 62 | 69 | 63 | 71 |
| 2008 | 75 | 74 | 59 | 60 | 74 | 76 | 73 | 70 | 90 | 76 | 82 | 52 |
| 2009 | 81 | 60 | 69 | 68 | 59 | 70 | 61 | 50 | 79 | 63 | 64 | 64 |
| 2010 | 48 | 48 | 55 | 30 | 52 | 45 | 41 | 10 | 18 | 30 | 20 | 25 |
| 2011 | 25 | 21 | 23 | 21 | 33 | 9 | 19 | 19 | 21 | 19 | 19 | 25 |
| 2012 | 21 | 18 | 15 | 9 | 4 | 4 | 6 | 7 | 5 | 5 | 4 | 7 |
| 2013 | 5 | 4 | 8 | 6 | 4 | 4 | 4 | 3 | 2 | 8 | 9 | 4 |
| 2014 | 10 | 10 | 9 | 5 | 5 | 5 | 1 | 4 | 3 | 4 | 4 | 8 |
| 2015 | 5 | 7 | 4 | 3 | 5 | 0 | 8 | 0 | 1 | -1 | 4 | 5 |
| 2016 | 1 | 6 | 2 | 3 | 3 | 1 | 5 | 2 | 2 | -2 | 0 | 6 |
| 2017 | 5 | 4 | 5 | 1 | 0 | -2 | -3 | -1 | 0 | 3 | 5 | 8 |
| 2018 | 6 | 5 | 4 | 0 | 5 | 3 | 2 | 0 | 0 | 5 | 3 | 2 |
| 2019 | 4 | 2 | 7 | 3 | 1 | -4 | 4 | 5 | 4 | -1 | 4 | 4 |
| 2020 | 0 | 4 | 3 | 4 | 4 | 3 | 5 | 2 | 3 | 3 | 6 | 4 |
| 2021 | 1 | 2 | 5 | 4 | 3 | 3 | 5 | 0 | 4 | 1 | 7 | 2 |
| 2022 | 4 | 3 | 6 | 3 | 3 | 5 | 1 | 6 | 1 | 6 | 2 | 3 |
| 2023 | 4 | 1 | 6 | 0 | 7 | 0 | 2 | 8 | 1 | 6 | 4 | 1 |
| 2024 | 4 | |||||||||||
| - = No Data Reported; -- = Not Applicable; NA = Not Available; W = Withheld to avoid disclosure of individual company data. |
| Release Date: 3/29/2024 |
| Next Release Date: 4/30/2024 |