|
Download Data (XLS File) |
|
||||||||
|
||||||||
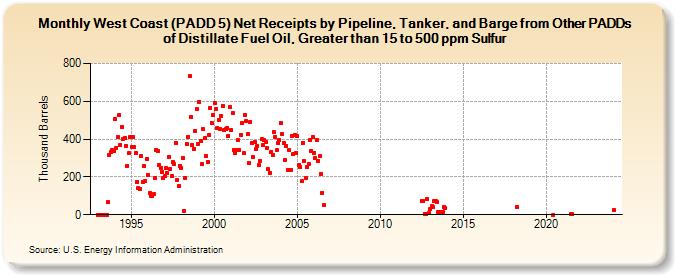
| West Coast (PADD 5) Net Receipts by Pipeline, Tanker, and Barge from Other PADDs of Distillate Fuel Oil, Greater than 15 to 500 ppm Sulfur (Thousand Barrels) | ||||||||
| Year | Jan | Feb | Mar | Apr | May | Jun | Jul | Aug | Sep | Oct | Nov | Dec |
|---|---|---|---|---|---|---|---|---|---|---|---|---|
| 1993 | 0 | 0 | 0 | 0 | 0 | 0 | 0 | 65 | 317 | 332 | 344 | 338 |
| 1994 | 504 | 354 | 412 | 525 | 369 | 465 | 402 | 408 | 363 | 259 | 324 | 412 |
| 1995 | 359 | 411 | 359 | 327 | 175 | 139 | 138 | 311 | 175 | 259 | 178 | 297 |
| 1996 | 211 | 116 | 100 | 99 | 109 | 196 | 343 | 338 | 262 | 249 | 226 | 192 |
| 1997 | 206 | 246 | 219 | 306 | 241 | 206 | 277 | 268 | 382 | 185 | 152 | 258 |
| 1998 | 248 | 301 | 20 | 194 | 376 | 413 | 733 | 518 | 369 | 348 | 443 | 559 |
| 1999 | 376 | 598 | 388 | 268 | 451 | 404 | 309 | 281 | 422 | 566 | 487 | 528 |
| 2000 | 592 | 561 | 461 | 502 | 455 | 521 | 574 | 446 | 452 | 460 | 416 | 570 |
| 2001 | 449 | 537 | 341 | 326 | 343 | 393 | 342 | 423 | 484 | 326 | 530 | 497 |
| 2002 | 425 | 276 | 493 | 382 | 306 | 385 | 345 | 366 | 262 | 286 | 399 | 368 |
| 2003 | 393 | 383 | 353 | 240 | 222 | 334 | 315 | 435 | 413 | 342 | 378 | 395 |
| 2004 | 486 | 426 | 379 | 292 | 366 | 239 | 340 | 238 | 418 | 319 | 422 | 328 |
| 2005 | 416 | 263 | 253 | 178 | 382 | 282 | 194 | 252 | 269 | 397 | 335 | 413 |
| 2006 | 328 | 298 | 395 | 286 | 308 | 216 | 117 | 51 | ||||
| 2012 | 73 | 73 | 5 | 5 | 82 | 7 | ||||||
| 2013 | 30 | 45 | 40 | 73 | 70 | 67 | 13 | 12 | 12 | 15 | 41 | 35 |
| 2018 | 40 | |||||||||||
| 2020 | 0 | |||||||||||
| 2021 | 2 | 2 | ||||||||||
| 2024 | 25 | |||||||||||
| - = No Data Reported; -- = Not Applicable; NA = Not Available; W = Withheld to avoid disclosure of individual company data. |
| Release Date: 6/28/2024 |
| Next Release Date: 7/31/2024 |
Referring Pages: