|
Download Data (XLS File) |
|
||||||||
|
||||||||
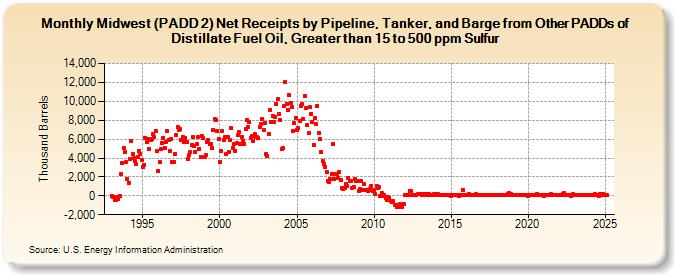
| Midwest (PADD 2) Net Receipts by Pipeline, Tanker, and Barge from Other PADDs of Distillate Fuel Oil, Greater than 15 to 500 ppm Sulfur (Thousand Barrels) | ||||||||
| Year | Jan | Feb | Mar | Apr | May | Jun | Jul | Aug | Sep | Oct | Nov | Dec |
|---|---|---|---|---|---|---|---|---|---|---|---|---|
| 1993 | 17 | -75 | -452 | -423 | -99 | -370 | -28 | 2,256 | 3,466 | 5,033 | 4,587 | 3,574 |
| 1994 | 1,785 | 1,389 | 3,942 | 5,816 | 4,472 | 3,967 | 3,634 | 3,363 | 4,082 | 4,755 | 4,376 | 3,813 |
| 1995 | 3,059 | 3,309 | 6,082 | 5,661 | 5,958 | 4,934 | 5,916 | 5,966 | 6,584 | 6,262 | 6,907 | 4,690 |
| 1996 | 2,645 | 3,564 | 4,910 | 5,609 | 6,132 | 5,052 | 5,676 | 6,829 | 5,884 | 4,688 | 6,031 | 3,527 |
| 1997 | 3,591 | 4,402 | 6,485 | 7,307 | 6,911 | 7,042 | 5,909 | 6,234 | 5,680 | 6,094 | 5,694 | 3,940 |
| 1998 | 4,309 | 4,588 | 5,364 | 6,231 | 5,251 | 4,672 | 5,433 | 6,198 | 4,981 | 4,146 | 6,348 | 6,067 |
| 1999 | 4,107 | 4,323 | 5,674 | 5,877 | 5,475 | 5,458 | 5,066 | 6,997 | 8,077 | 8,029 | 6,845 | 5,999 |
| 2000 | 3,594 | 4,709 | 6,883 | 5,888 | 6,251 | 4,415 | 6,273 | 4,657 | 5,872 | 7,139 | 5,038 | 5,465 |
| 2001 | 4,726 | 5,560 | 6,391 | 6,803 | 5,486 | 6,250 | 5,785 | 5,450 | 7,028 | 8,036 | 7,319 | 7,846 |
| 2002 | 6,098 | 6,307 | 5,836 | 6,510 | 6,191 | 6,171 | 6,089 | 7,294 | 7,572 | 8,077 | 6,924 | 7,672 |
| 2003 | 4,431 | 4,196 | 6,567 | 9,128 | 7,849 | 8,463 | 7,793 | 8,347 | 9,716 | 10,224 | 8,703 | 8,017 |
| 2004 | 4,900 | 5,014 | 9,466 | 12,019 | 9,740 | 9,081 | 10,713 | 9,840 | 9,361 | 6,864 | 7,708 | 8,195 |
| 2005 | 6,995 | 7,169 | 7,958 | 9,502 | 9,687 | 8,102 | 10,511 | 9,278 | 7,462 | 6,618 | 9,383 | 8,697 |
| 2006 | 7,805 | 5,428 | 8,228 | 7,623 | 9,482 | 6,680 | 6,061 | 4,618 | 3,691 | 3,395 | 3,035 | 2,513 |
| 2007 | 1,616 | 1,482 | 1,767 | 2,303 | 5,462 | 1,761 | 2,288 | 2,286 | 1,921 | 2,535 | 1,624 | 847 |
| 2008 | 742 | 831 | 1,296 | 1,026 | 1,890 | 1,523 | 1,553 | 828 | 944 | 1,767 | 1,573 | 1,594 |
| 2009 | 554 | 711 | 1,540 | 619 | 1,232 | 633 | 592 | 553 | 621 | 757 | 1,056 | 554 |
| 2010 | 576 | 217 | 1,058 | 825 | 952 | -58 | 303 | 20 | 84 | -181 | -462 | -131 |
| 2011 | -248 | -547 | -617 | -588 | -955 | -932 | -1,169 | -995 | -899 | -1,214 | -1,135 | -875 |
| 2012 | 38 | 129 | 69 | 71 | 561 | 493 | 41 | 36 | 84 | 115 | 158 | 233 |
| 2013 | 169 | 41 | 241 | 63 | 153 | 233 | 93 | 139 | 136 | 105 | 82 | 224 |
| 2014 | 69 | 156 | 194 | 59 | 135 | 86 | 44 | 93 | 134 | 66 | 105 | 134 |
| 2015 | 9 | 64 | 106 | 61 | 104 | 53 | 5 | 116 | 97 | 663 | 58 | 130 |
| 2016 | 53 | 79 | 178 | 53 | 129 | 105 | 43 | 144 | 65 | 56 | 92 | 100 |
| 2017 | 65 | 95 | 49 | 95 | 100 | 110 | 105 | 50 | 113 | 105 | 104 | 110 |
| 2018 | 78 | 85 | 77 | 113 | 50 | 96 | 114 | 114 | 172 | 278 | 102 | 153 |
| 2019 | 124 | 134 | 137 | 93 | 125 | 98 | 55 | 123 | 109 | 80 | 117 | 130 |
| 2020 | 29 | 36 | 84 | 71 | 73 | 120 | 43 | 164 | 125 | 73 | 80 | 91 |
| 2021 | 23 | 42 | 42 | 116 | 104 | 100 | 191 | 81 | 60 | 136 | 134 | 108 |
| 2022 | 135 | 54 | 86 | 209 | 300 | 101 | 117 | 75 | 91 | 25 | 104 | 147 |
| 2023 | 88 | 56 | 76 | 69 | 98 | 105 | 109 | 118 | 137 | 95 | 126 | 133 |
| 2024 | 133 | |||||||||||
| - = No Data Reported; -- = Not Applicable; NA = Not Available; W = Withheld to avoid disclosure of individual company data. |
| Release Date: 3/29/2024 |
| Next Release Date: 4/30/2024 |
Referring Pages: