|
Download Data (XLS File) |
|
||||||||
|
||||||||
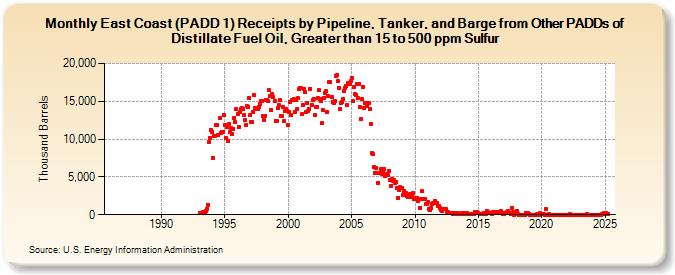
| East Coast (PADD 1) Receipts by Pipeline, Tanker, and Barge from Other PADDs of Distillate Fuel Oil, Greater than 15 to 500 ppm Sulfur (Thousand Barrels) | ||||||||
| Year | Jan | Feb | Mar | Apr | May | Jun | Jul | Aug | Sep | Oct | Nov | Dec |
|---|---|---|---|---|---|---|---|---|---|---|---|---|
| 1986 | -- | -- | -- | -- | -- | -- | -- | -- | -- | -- | -- | -- |
| 1987 | -- | -- | -- | -- | -- | -- | -- | -- | -- | -- | -- | -- |
| 1988 | -- | -- | -- | -- | -- | -- | -- | -- | -- | -- | -- | -- |
| 1989 | -- | -- | -- | -- | -- | -- | -- | -- | -- | -- | -- | -- |
| 1990 | -- | -- | -- | -- | -- | -- | -- | -- | -- | -- | -- | -- |
| 1991 | -- | -- | -- | -- | -- | -- | -- | -- | -- | -- | -- | -- |
| 1992 | -- | -- | -- | -- | -- | -- | -- | -- | -- | -- | -- | -- |
| 1993 | 183 | 180 | 200 | 307 | 238 | 190 | 546 | 793 | 1,326 | 9,666 | 10,184 | 11,213 |
| 1994 | 10,910 | 7,538 | 10,434 | 10,363 | 11,889 | 11,800 | 10,593 | 12,754 | 10,846 | 10,981 | 10,997 | 13,143 |
| 1995 | 11,842 | 10,147 | 11,575 | 9,734 | 11,996 | 10,926 | 11,464 | 10,722 | 11,389 | 12,782 | 12,223 | 13,996 |
| 1996 | 13,289 | 11,627 | 13,582 | 13,957 | 14,125 | 13,928 | 13,192 | 12,494 | 11,874 | 14,315 | 14,292 | 15,470 |
| 1997 | 13,184 | 12,313 | 12,254 | 13,570 | 15,779 | 14,088 | 13,932 | 13,956 | 14,236 | 14,666 | 14,989 | 15,074 |
| 1998 | 13,015 | 12,531 | 13,061 | 15,234 | 15,189 | 15,003 | 16,459 | 15,756 | 13,856 | 15,909 | 15,535 | 15,004 |
| 1999 | 12,454 | 12,335 | 14,124 | 14,485 | 15,200 | 13,067 | 13,091 | 14,195 | 12,361 | 13,667 | 13,957 | 13,697 |
| 2000 | 11,920 | 13,573 | 14,899 | 13,151 | 15,214 | 15,326 | 13,519 | 15,233 | 13,975 | 15,371 | 16,579 | 16,718 |
| 2001 | 16,704 | 13,351 | 14,529 | 16,568 | 16,186 | 13,633 | 14,767 | 13,747 | 13,982 | 16,663 | 14,526 | 15,131 |
| 2002 | 15,311 | 13,205 | 14,198 | 14,247 | 15,372 | 16,443 | 15,340 | 15,054 | 12,079 | 13,800 | 15,496 | 16,128 |
| 2003 | 16,313 | 13,531 | 15,722 | 17,590 | 17,525 | 15,533 | 14,910 | 14,774 | 15,099 | 18,374 | 18,424 | 17,674 |
| 2004 | 16,798 | 13,982 | 14,810 | 14,957 | 15,335 | 16,344 | 16,803 | 17,015 | 14,496 | 17,402 | 17,336 | 17,662 |
| 2005 | 18,131 | 15,035 | 16,919 | 15,924 | 15,811 | 17,328 | 15,399 | 17,257 | 14,187 | 12,632 | 15,238 | 16,871 |
| 2006 | 14,127 | 14,755 | 14,807 | 14,389 | 14,798 | 13,921 | 11,968 | 8,175 | 8,059 | 6,329 | 5,533 | 6,193 |
| 2007 | 5,456 | 4,231 | 5,498 | 5,496 | 5,995 | 5,393 | 5,618 | 6,039 | 5,085 | 5,372 | 5,305 | 5,833 |
| 2008 | 4,576 | 3,835 | 4,779 | 4,400 | 4,545 | 4,236 | 4,333 | 3,575 | 2,262 | 3,203 | 3,606 | 3,554 |
| 2009 | 3,548 | 2,664 | 3,189 | 2,862 | 2,494 | 2,322 | 2,452 | 2,688 | 2,366 | 2,522 | 2,836 | 2,143 |
| 2010 | 2,181 | 2,063 | 2,220 | 1,863 | 2,083 | 950 | 2,066 | 3,094 | 2,126 | 2,047 | 1,373 | 1,401 |
| 2011 | 1,689 | 693 | 670 | 853 | 1,464 | 1,548 | 1,536 | 1,852 | 1,582 | 1,615 | 1,196 | 1,134 |
| 2012 | 951 | 681 | 494 | 727 | 735 | 771 | 331 | 335 | 163 | 257 | 219 | 270 |
| 2013 | 96 | 69 | 207 | 182 | 138 | 185 | 107 | 146 | 196 | 106 | 167 | 203 |
| 2014 | 127 | 173 | 158 | 115 | 124 | 58 | 118 | 46 | 42 | 372 | 295 | 312 |
| 2015 | 236 | 125 | 48 | 50 | 95 | 241 | 158 | 148 | 433 | 358 | 196 | 267 |
| 2016 | 174 | 107 | 302 | 181 | 323 | 239 | 337 | 424 | 392 | 458 | 191 | 94 |
| 2017 | 90 | 164 | 207 | 386 | 477 | 199 | 253 | 105 | 828 | 331 | 26 | 237 |
| 2018 | 473 | 143 | 26 | 0 | 16 | 0 | 0 | 1 | 0 | 175 | 265 | 236 |
| 2019 | 86 | 0 | 0 | 1 | 1 | 0 | 0 | 56 | 0 | 4 | 187 | 39 |
| 2020 | 65 | 63 | 42 | 21 | 695 | 0 | 22 | 144 | 0 | 0 | 0 | 0 |
| 2021 | 0 | 0 | 1 | 1 | 1 | 1 | 1 | 1 | 1 | 1 | 1 | 0 |
| 2022 | 0 | 0 | 1 | 65 | 1 | 1 | 0 | 1 | 1 | 1 | 1 | 1 |
| 2023 | 0 | 0 | 0 | 0 | 0 | 0 | 0 | 99 | 0 | 0 | 0 | 0 |
| 2024 | 0 | |||||||||||
| - = No Data Reported; -- = Not Applicable; NA = Not Available; W = Withheld to avoid disclosure of individual company data. |
| Release Date: 3/29/2024 |
| Next Release Date: 4/30/2024 |
Referring Pages: