|
Download Data (XLS File) |
|
||||||||
|
||||||||
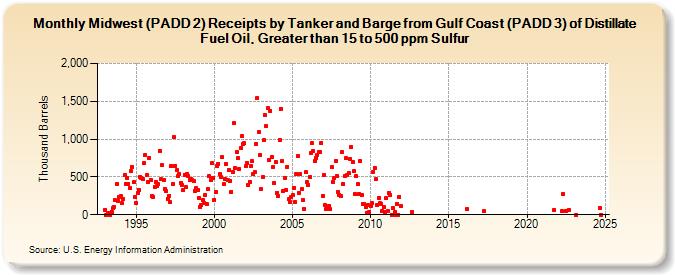
| Midwest (PADD 2) Receipts by Tanker and Barge from Gulf Coast (PADD 3) of Distillate Fuel Oil, Greater than 15 to 500 ppm Sulfur (Thousand Barrels) | ||||||||
| Year | Jan | Feb | Mar | Apr | May | Jun | Jul | Aug | Sep | Oct | Nov | Dec |
|---|---|---|---|---|---|---|---|---|---|---|---|---|
| 1993 | 67 | 0 | 29 | 25 | 0 | 42 | 90 | 107 | 189 | 405 | 186 | 239 |
| 1994 | 245 | 150 | 206 | 522 | 407 | 492 | 403 | 353 | 575 | 633 | 427 | 230 |
| 1995 | 157 | 290 | 329 | 505 | 487 | 472 | 678 | 791 | 519 | 437 | 754 | 458 |
| 1996 | 252 | 236 | 368 | 427 | 379 | 401 | 845 | 472 | 651 | 464 | 345 | 308 |
| 1997 | 214 | 253 | 163 | 648 | 406 | 1,025 | 648 | 585 | 507 | 539 | 422 | 395 |
| 1998 | 324 | 529 | 362 | 544 | 510 | 456 | 473 | 460 | 441 | 315 | 355 | 333 |
| 1999 | 219 | 107 | 125 | 189 | 158 | 258 | 140 | 346 | 508 | 464 | 687 | 490 |
| 2000 | 199 | 300 | 642 | 677 | 537 | 496 | 758 | 400 | 469 | 673 | 460 | 586 |
| 2001 | 452 | 305 | 568 | 1,212 | 615 | 828 | 747 | 607 | 881 | 1,035 | 936 | 945 |
| 2002 | 640 | 689 | 387 | 438 | 645 | 705 | 534 | 559 | 937 | 1,542 | 1,092 | 792 |
| 2003 | 336 | 499 | 983 | 1,318 | 1,168 | 1,406 | 729 | 1,376 | 762 | 634 | 423 | 700 |
| 2004 | 292 | 252 | 990 | 1,403 | 712 | 313 | 484 | 329 | 635 | 204 | 168 | 240 |
| 2005 | 261 | 356 | 170 | 542 | 775 | 293 | 532 | 338 | 200 | 69 | 563 | 428 |
| 2006 | 394 | 502 | 815 | 942 | 843 | 713 | 746 | 793 | 825 | 828 | 944 | 249 |
| 2007 | 528 | 123 | 75 | 72 | 117 | 75 | 628 | 433 | 484 | 712 | 515 | 304 |
| 2008 | 261 | 243 | 829 | 403 | 513 | 745 | 531 | 555 | 739 | 895 | 692 | 573 |
| 2009 | 270 | 506 | 403 | 277 | 710 | 255 | 148 | 141 | 101 | 25 | 124 | 35 |
| 2010 | 114 | 151 | 565 | 621 | 466 | 125 | 224 | 150 | 145 | 50 | 100 | 40 |
| 2011 | 219 | 45 | 292 | 265 | 0 | 94 | 0 | 40 | 145 | 0 | 240 | 115 |
| 2012 | 42 | |||||||||||
| 2016 | 74 | |||||||||||
| 2017 | 44 | |||||||||||
| 2021 | 60 | |||||||||||
| 2022 | 43 | 275 | 44 | 66 | ||||||||
| 2023 | 0 | |||||||||||
| - = No Data Reported; -- = Not Applicable; NA = Not Available; W = Withheld to avoid disclosure of individual company data. |
| Release Date: 3/29/2024 |
| Next Release Date: 4/30/2024 |