|
Download Data (XLS File) |
|
||||||||
|
||||||||
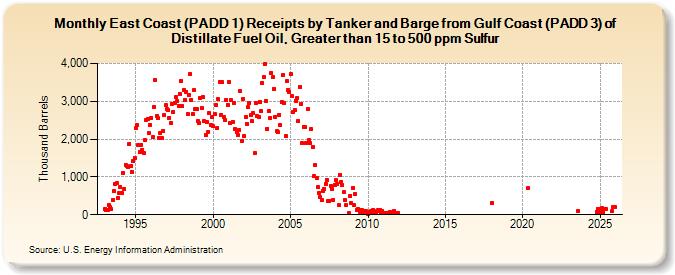
| East Coast (PADD 1) Receipts by Tanker and Barge from Gulf Coast (PADD 3) of Distillate Fuel Oil, Greater than 15 to 500 ppm Sulfur (Thousand Barrels) | ||||||||
| Year | Jan | Feb | Mar | Apr | May | Jun | Jul | Aug | Sep | Oct | Nov | Dec |
|---|---|---|---|---|---|---|---|---|---|---|---|---|
| 1993 | 161 | 127 | 137 | 252 | 208 | 147 | 398 | 619 | 813 | 830 | 450 | 565 |
| 1994 | 733 | 566 | 1,116 | 686 | 1,321 | 1,279 | 1,267 | 1,879 | 1,287 | 1,141 | 1,408 | 1,505 |
| 1995 | 2,292 | 2,372 | 1,836 | 1,665 | 1,856 | 1,719 | 1,638 | 1,972 | 2,504 | 2,534 | 2,161 | 2,377 |
| 1996 | 2,570 | 2,052 | 2,852 | 3,560 | 2,613 | 2,548 | 2,026 | 2,162 | 2,027 | 2,221 | 2,637 | 2,893 |
| 1997 | 2,792 | 2,767 | 2,571 | 2,435 | 2,941 | 2,719 | 2,964 | 3,113 | 3,012 | 2,876 | 3,205 | 3,545 |
| 1998 | 2,875 | 3,293 | 3,036 | 3,250 | 2,655 | 3,159 | 3,723 | 3,042 | 2,669 | 3,290 | 2,804 | 2,808 |
| 1999 | 2,469 | 2,421 | 3,079 | 2,827 | 3,105 | 2,470 | 2,103 | 2,462 | 2,197 | 2,682 | 2,365 | 2,597 |
| 2000 | 2,339 | 2,657 | 2,913 | 2,296 | 3,051 | 3,511 | 2,646 | 3,502 | 2,588 | 2,517 | 3,030 | 2,914 |
| 2001 | 3,507 | 2,414 | 3,026 | 2,465 | 2,943 | 2,255 | 2,179 | 2,111 | 2,237 | 3,259 | 1,951 | 3,063 |
| 2002 | 2,081 | 2,588 | 2,406 | 2,855 | 2,955 | 2,625 | 2,470 | 2,690 | 1,627 | 2,954 | 2,598 | 2,591 |
| 2003 | 2,982 | 2,732 | 3,487 | 3,652 | 3,977 | 3,003 | 2,274 | 2,730 | 2,562 | 3,749 | 3,635 | 3,337 |
| 2004 | 2,594 | 2,204 | 2,177 | 2,645 | 2,376 | 2,973 | 3,699 | 2,945 | 2,079 | 3,536 | 3,289 | 3,246 |
| 2005 | 3,717 | 3,135 | 2,717 | 2,781 | 3,003 | 3,092 | 2,480 | 3,387 | 2,931 | 1,895 | 2,327 | 2,314 |
| 2006 | 1,897 | 2,798 | 1,963 | 1,894 | 2,254 | 1,796 | 1,017 | 1,310 | 975 | 734 | 585 | 460 |
| 2007 | 377 | 637 | 682 | 802 | 927 | 364 | 374 | 757 | 675 | 395 | 788 | 914 |
| 2008 | 816 | 256 | 1,062 | 870 | 784 | 596 | 384 | 248 | 42 | 497 | 301 | |
| 2009 | 712 | 252 | 537 | 131 | 157 | 132 | 78 | 118 | 53 | 98 | 91 | 73 |
| 2010 | 14 | 72 | 96 | 42 | 125 | 50 | 48 | 106 | 120 | 132 | 54 | 100 |
| 2011 | 42 | 56 | 52 | 52 | 54 | 84 | 52 | 54 | 96 | 56 | 42 | 42 |
| 2012 | 28 | 53 | 28 | 56 | 56 | 56 | 70 | 42 | 28 | 70 | 42 | |
| 2018 | 311 | |||||||||||
| 2020 | 695 | |||||||||||
| 2023 | 99 | |||||||||||
| - = No Data Reported; -- = Not Applicable; NA = Not Available; W = Withheld to avoid disclosure of individual company data. |
| Release Date: 3/29/2024 |
| Next Release Date: 4/30/2024 |