|
Download Data (XLS File) |
|
||||||||
|
||||||||
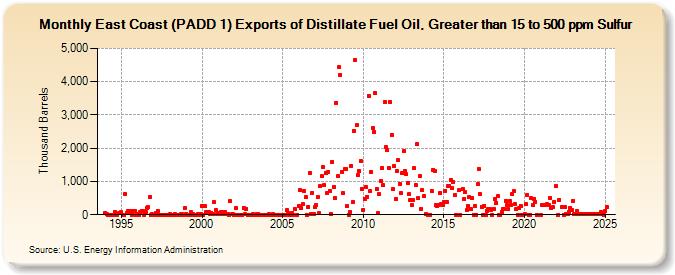
| East Coast (PADD 1) Exports of Distillate Fuel Oil, Greater than 15 to 500 ppm Sulfur (Thousand Barrels) | ||||||||
| Year | Jan | Feb | Mar | Apr | May | Jun | Jul | Aug | Sep | Oct | Nov | Dec |
|---|---|---|---|---|---|---|---|---|---|---|---|---|
| 1994 | 42 | 14 | 1 | 0 | 2 | 0 | 1 | 84 | 15 | 3 | 42 | 43 |
| 1995 | 83 | 4 | 1 | 611 | 61 | 107 | 67 | 124 | 5 | 118 | 113 | 4 |
| 1996 | 7 | 6 | 70 | 122 | 120 | 5 | 69 | 211 | 223 | 536 | 5 | 9 |
| 1997 | 5 | 3 | 41 | 108 | 5 | 5 | 5 | 4 | 3 | 6 | 3 | 5 |
| 1998 | 8 | 4 | 5 | 6 | 9 | 3 | 5 | 6 | 7 | 14 | 4 | 198 |
| 1999 | 13 | 6 | 4 | 6 | 67 | 8 | 6 | 5 | 5 | 9 | 4 | 8 |
| 2000 | 270 | 6 | 253 | 89 | 95 | 68 | 27 | 64 | 26 | 377 | 135 | 8 |
| 2001 | 37 | 12 | 73 | 34 | 83 | 85 | 17 | 19 | 4 | 402 | 10 | 7 |
| 2002 | 4 | 191 | 1 | 3 | 0 | 1 | 1 | 212 | 8 | 182 | 3 | 2 |
| 2003 | 2 | 6 | 11 | 2 | 3 | 7 | 23 | 6 | 3 | 1 | 2 | 3 |
| 2004 | 2 | 6 | 18 | 1 | 2 | 9 | 0 | 3 | 2 | 2 | 6 | |
| 2005 | 1 | 1 | 1 | 130 | 53 | 1 | 2 | 47 | 2 | 176 | 1 | |
| 2006 | 257 | 738 | 193 | 311 | 718 | 518 | 3 | 246 | 1,256 | 26 | 656 | 26 |
| 2007 | 224 | 297 | 537 | 39 | 852 | 1,153 | 1,423 | 881 | 1,264 | 641 | 1,286 | 716 |
| 2008 | 27 | 1,599 | 834 | 503 | 3,359 | 1,149 | 4,438 | 4,215 | 1,291 | 638 | 1,371 | 1,375 |
| 2009 | 266 | 2 | 78 | 1,469 | 380 | 2,527 | 4,658 | 2,689 | 1,179 | 1,300 | 1,629 | 785 |
| 2010 | 151 | 485 | 835 | 543 | 3,577 | 704 | 1,291 | 2,602 | 2,494 | 3,652 | 773 | 44 |
| 2011 | 611 | 1,020 | 1,409 | 885 | 3,391 | 2,022 | 1,952 | 1,404 | 3,386 | 2,399 | 771 | 1,460 |
| 2012 | 479 | 1,325 | 1,642 | 935 | 638 | 1,242 | 1,910 | 1,311 | 1,209 | 939 | 613 | 439 |
| 2013 | 299 | 436 | 1,397 | 887 | 2,117 | 497 | 1,152 | 179 | 741 | 549 | 20 | |
| 2014 | 1 | 0 | 0 | 719 | 1,358 | 1,323 | 281 | 249 | 291 | 658 | 334 | 306 |
| 2015 | 375 | 727 | 395 | 858 | 875 | 1,052 | 807 | 979 | 578 | 0 | 730 | |
| 2016 | 1 | 787 | 478 | 678 | 146 | 266 | 528 | 168 | 498 | 0 | 263 | |
| 2017 | 0 | 919 | 1,381 | 614 | 246 | 0 | 277 | 1 | 126 | 171 | 186 | 140 |
| 2018 | 0 | 177 | 461 | 360 | 555 | 1 | 0 | 80 | 175 | 184 | 420 | 291 |
| 2019 | 165 | 414 | 300 | 614 | 703 | 313 | 178 | 1 | 209 | 262 | 0 | |
| 2020 | 21 | 314 | 601 | 4 | 2 | 500 | 289 | 483 | 397 | 1 | ||
| 2021 | 0 | 300 | 305 | 310 | 305 | 505 | 188 | 225 | 392 | 851 | ||
| 2022 | 0 | 451 | 241 | 1 | 245 | 18 | 16 | 89 | 211 | 150 | ||
| 2023 | 421 | 21 | 27 | 101 | 26 | 10 | 13 | 19 | 20 | 19 | 24 | 19 |
| 2024 | 22 | |||||||||||
| - = No Data Reported; -- = Not Applicable; NA = Not Available; W = Withheld to avoid disclosure of individual company data. |
| Release Date: 3/29/2024 |
| Next Release Date: 4/30/2024 |