|
Download Data (XLS File) |
|
||||||||
|
||||||||
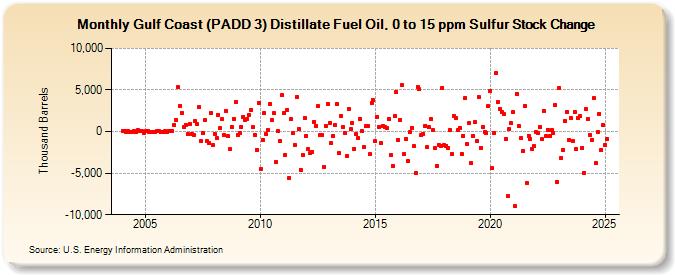
| Gulf Coast (PADD 3) Distillate Fuel Oil, 0 to 15 ppm Sulfur Stock Change (Thousand Barrels) | ||||||||
| Year | Jan | Feb | Mar | Apr | May | Jun | Jul | Aug | Sep | Oct | Nov | Dec |
|---|---|---|---|---|---|---|---|---|---|---|---|---|
| 2004 | 119 | 34 | -32 | 40 | -10 | -16 | 49 | -49 | 175 | 28 | 16 | -231 |
| 2005 | 65 | 19 | -37 | -12 | -76 | -11 | 62 | 12 | -21 | -39 | 28 | -10 |
| 2006 | 80 | 20 | 92 | 796 | 1,412 | 5,326 | 3,082 | 2,278 | 564 | 844 | -326 | 871 |
| 2007 | -237 | -406 | 1,246 | 898 | 2,911 | -1,093 | -214 | 1,382 | -1,128 | -1,322 | 2,233 | -1,607 |
| 2008 | -284 | -833 | 2,049 | 387 | 1,456 | -399 | 2,527 | -518 | -2,137 | 581 | 1,522 | 3,590 |
| 2009 | -448 | -233 | 580 | 1,808 | 1,439 | 1,567 | 2,049 | 2,587 | 511 | -383 | -2,188 | 3,476 |
| 2010 | -4,517 | -1,072 | 2,220 | -338 | 185 | 3,333 | 1,397 | 2,177 | -3,602 | 64 | -1,121 | 4,358 |
| 2011 | 2,214 | -2,762 | 2,619 | -5,559 | 1,453 | -209 | -1,588 | 4,137 | 258 | -4,581 | -2,788 | 1,686 |
| 2012 | -493 | -2,145 | -2,623 | -2,418 | 1,191 | 714 | 3,021 | -464 | -401 | -4,232 | 711 | 3,325 |
| 2013 | 1,033 | -1,409 | -488 | 783 | 3,294 | -2,610 | 1,900 | 544 | -197 | -2,953 | 2,753 | 249 |
| 2014 | 1,080 | -2,051 | -349 | -765 | 1,558 | 119 | -1,844 | 650 | 665 | -2,732 | 3,432 | 3,740 |
| 2015 | -1,180 | 1,755 | 596 | -1,427 | 709 | 570 | 391 | 1,533 | -2,834 | -4,113 | 1,854 | 4,724 |
| 2016 | -965 | 1,400 | 5,556 | -2,645 | -850 | -3,552 | -94 | 463 | -1,783 | -5,000 | 5,363 | 5,079 |
| 2017 | -470 | -249 | 707 | -1,910 | 520 | 1,494 | 184 | -1,937 | -4,109 | -1,562 | -1,740 | 5,292 |
| 2018 | -1,652 | -1,696 | -1,993 | 132 | -2,686 | 1,913 | 1,629 | 170 | 448 | -2,647 | -495 | 4,030 |
| 2019 | -1,524 | 1,033 | -3,783 | -527 | 1,092 | -1,159 | 4,097 | -1,928 | 538 | -94 | -116 | 3,044 |
| 2020 | 4,874 | -4,402 | -155 | 7,100 | 3,562 | 2,725 | 2,411 | 2,109 | -870 | -7,802 | 282 | 984 |
| 2021 | 2,323 | -9,006 | 4,559 | 659 | -776 | -2,313 | 3,089 | -6,162 | -475 | -889 | -2,115 | -1,744 |
| 2022 | -102 | -227 | 543 | -930 | 2,482 | -569 | 243 | -589 | 216 | -127 | 3,219 | -6,079 |
| 2023 | 5,171 | -3,214 | -2,034 | 1,229 | 2,386 | -905 | 1,611 | -1,079 | 2,370 | -1,885 | 1,569 | 1,859 |
| 2024 | -1,947 | -4,940 | 2,683 | 1,492 | ||||||||
| - = No Data Reported; -- = Not Applicable; NA = Not Available; W = Withheld to avoid disclosure of individual company data. |
| Release Date: 6/28/2024 |
| Next Release Date: 7/31/2024 |