|
Download Data (XLS File) |
|
||||||||
|
||||||||
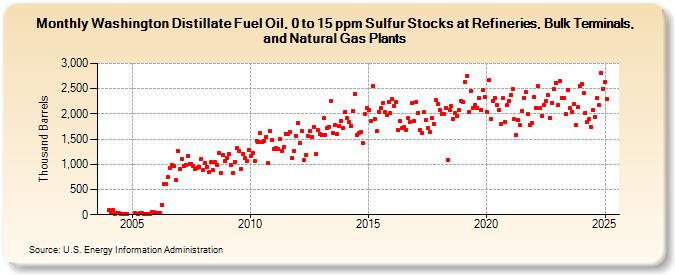
| Washington Distillate Fuel Oil, 0 to 15 ppm Sulfur Stocks at Refineries, Bulk Terminals, and Natural Gas Plants (Thousand Barrels) | ||||||||
| Year | Jan | Feb | Mar | Apr | May | Jun | Jul | Aug | Sep | Oct | Nov | Dec |
|---|---|---|---|---|---|---|---|---|---|---|---|---|
| 2004 | 94 | 49 | 96 | 8 | 30 | 29 | 15 | 8 | 8 | 18 | ||
| 2005 | 25 | 8 | 31 | 26 | 11 | 19 | 8 | 14 | 47 | 48 | ||
| 2006 | 29 | 39 | 43 | 199 | 609 | 604 | 742 | 935 | 991 | 964 | 693 | 1,258 |
| 2007 | 915 | 1,103 | 969 | 988 | 1,168 | 1,012 | 1,014 | 964 | 914 | 935 | 952 | 1,096 |
| 2008 | 883 | 1,020 | 951 | 838 | 1,039 | 881 | 1,045 | 986 | 1,223 | 818 | 1,181 | 1,060 |
| 2009 | 1,125 | 1,206 | 980 | 824 | 1,053 | 1,321 | 1,267 | 898 | 1,204 | 1,124 | 1,060 | 1,293 |
| 2010 | 1,155 | 1,215 | 1,064 | 1,472 | 1,446 | 1,613 | 1,441 | 1,459 | 1,547 | 1,018 | 1,652 | 1,489 |
| 2011 | 1,303 | 1,316 | 1,307 | 1,501 | 1,269 | 1,353 | 1,607 | 1,599 | 1,641 | 1,132 | 1,268 | 1,571 |
| 2012 | 1,827 | 1,416 | 1,652 | 1,078 | 1,191 | 1,570 | 1,653 | 1,544 | 1,736 | 1,206 | 1,675 | 1,596 |
| 2013 | 1,577 | 1,911 | 1,590 | 1,722 | 1,745 | 2,253 | 1,616 | 1,774 | 1,594 | 1,762 | 1,859 | 1,717 |
| 2014 | 2,047 | 1,925 | 1,838 | 1,768 | 2,065 | 2,397 | 1,577 | 1,619 | 1,643 | 1,417 | 1,997 | 2,125 |
| 2015 | 2,084 | 1,853 | 2,553 | 1,902 | 1,651 | 2,041 | 2,110 | 2,209 | 2,028 | 1,986 | 2,240 | 2,016 |
| 2016 | 2,296 | 2,155 | 2,230 | 1,681 | 1,852 | 1,716 | 1,744 | 1,679 | 1,910 | 1,841 | 2,216 | 1,851 |
| 2017 | 2,245 | 2,024 | 1,687 | 1,630 | 2,028 | 1,876 | 1,714 | 1,637 | 1,919 | 1,807 | 2,272 | 2,198 |
| 2018 | 2,082 | 2,007 | 1,999 | 2,123 | 1,092 | 2,083 | 2,149 | 1,895 | 2,008 | 1,958 | 2,073 | 2,258 |
| 2019 | 2,236 | 2,624 | 2,748 | 2,040 | 2,448 | 2,121 | 2,186 | 2,124 | 2,315 | 2,069 | 2,472 | 2,343 |
| 2020 | 2,038 | 2,675 | 1,899 | 2,255 | 2,322 | 2,172 | 2,077 | 1,808 | 2,309 | 1,834 | 2,170 | 2,250 |
| 2021 | 2,370 | 2,496 | 1,889 | 1,577 | 1,877 | 1,771 | 2,052 | 2,325 | 2,434 | 1,989 | 1,775 | 1,811 |
| 2022 | 2,338 | 2,113 | 2,556 | 2,109 | 1,967 | 2,168 | 2,254 | 2,365 | 1,924 | 2,224 | 2,487 | 2,622 |
| 2023 | 2,169 | 2,657 | 2,315 | 2,317 | 1,996 | 2,445 | 2,123 | 2,033 | 2,160 | 1,783 | 2,133 | 2,558 |
| 2024 | 2,599 | 2,424 | 2,027 | 1,837 | ||||||||
| - = No Data Reported; -- = Not Applicable; NA = Not Available; W = Withheld to avoid disclosure of individual company data. |
| Release Date: 6/28/2024 |
| Next Release Date: 7/31/2024 |