|
Download Data (XLS File) |
|
||||||||
|
||||||||
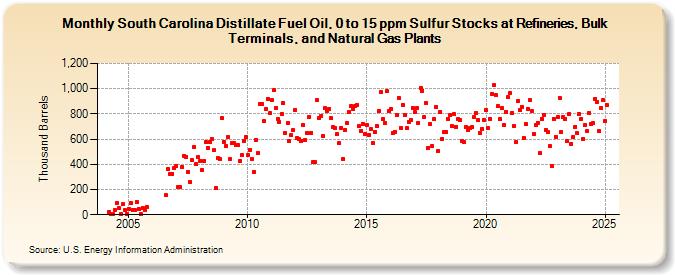
| South Carolina Distillate Fuel Oil, 0 to 15 ppm Sulfur Stocks at Refineries, Bulk Terminals, and Natural Gas Plants (Thousand Barrels) | ||||||||
| Year | Jan | Feb | Mar | Apr | May | Jun | Jul | Aug | Sep | Oct | Nov | Dec |
|---|---|---|---|---|---|---|---|---|---|---|---|---|
| 2004 | 25 | 7 | 7 | 39 | 92 | 54 | 8 | 85 | 34 | 7 | ||
| 2005 | 48 | 92 | 38 | 39 | 101 | 49 | 8 | 55 | 35 | 64 | ||
| 2006 | 154 | 362 | 327 | 326 | 372 | |||||||
| 2007 | 389 | 222 | 217 | 380 | 469 | 461 | 340 | 261 | 431 | 539 | 404 | 457 |
| 2008 | 429 | 357 | 430 | 574 | 533 | 580 | 601 | 513 | 212 | 451 | 441 | 769 |
| 2009 | 579 | 546 | 617 | 440 | 566 | 571 | 550 | 552 | 429 | 473 | 581 | 618 |
| 2010 | 474 | 517 | 444 | 341 | 593 | 489 | 876 | 880 | 740 | 837 | 921 | 804 |
| 2011 | 910 | 989 | 848 | 761 | 736 | 803 | 886 | 650 | 728 | 582 | 632 | 671 |
| 2012 | 832 | 608 | 598 | 588 | 710 | 589 | 651 | 777 | 652 | 419 | 418 | 907 |
| 2013 | 767 | 787 | 623 | 843 | 821 | 841 | 766 | 695 | 689 | 638 | 566 | 691 |
| 2014 | 443 | 672 | 729 | 815 | 859 | 839 | 862 | 872 | 703 | 666 | 720 | 640 |
| 2015 | 711 | 636 | 680 | 572 | 657 | 704 | 826 | 975 | 757 | 731 | 978 | 822 |
| 2016 | 836 | 650 | 658 | 788 | 928 | 691 | 871 | 789 | 687 | 738 | 753 | 847 |
| 2017 | 815 | 843 | 730 | 1,005 | 985 | 776 | 886 | 532 | 717 | 545 | 758 | 854 |
| 2018 | 506 | 816 | 603 | 658 | 655 | 761 | 789 | 703 | 796 | 698 | 759 | 751 |
| 2019 | 581 | 575 | 696 | 669 | 692 | 693 | 778 | 810 | 749 | 650 | 682 | 752 |
| 2020 | 831 | 686 | 763 | 960 | 1,026 | 946 | 862 | 757 | 846 | 715 | 816 | 933 |
| 2021 | 965 | 809 | 706 | 579 | 902 | 831 | 854 | 612 | 718 | 839 | 907 | 820 |
| 2022 | 643 | 708 | 729 | 490 | 761 | 788 | 673 | 654 | 544 | 387 | 763 | 620 |
| 2023 | 773 | 897 | 655 | 777 | 761 | 583 | 798 | 562 | 618 | 699 | 645 | 800 |
| 2024 | 762 | 601 | 713 | 666 | ||||||||
| - = No Data Reported; -- = Not Applicable; NA = Not Available; W = Withheld to avoid disclosure of individual company data. |
| Release Date: 6/28/2024 |
| Next Release Date: 7/31/2024 |