|
Download Data (XLS File) |
|
||||||||
|
||||||||
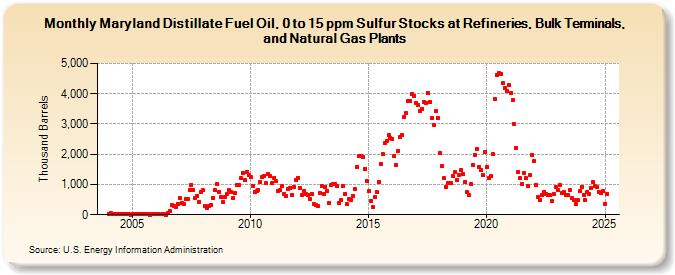
| Maryland Distillate Fuel Oil, 0 to 15 ppm Sulfur Stocks at Refineries, Bulk Terminals, and Natural Gas Plants (Thousand Barrels) | ||||||||
| Year | Jan | Feb | Mar | Apr | May | Jun | Jul | Aug | Sep | Oct | Nov | Dec |
|---|---|---|---|---|---|---|---|---|---|---|---|---|
| 2004 | 32 | 51 | 40 | 13 | 13 | 19 | 17 | 11 | 8 | 8 | 13 | 5 |
| 2005 | 17 | 22 | 22 | 22 | 17 | 17 | 11 | 25 | 10 | 6 | 16 | 14 |
| 2006 | 13 | 10 | 12 | 22 | 4 | 65 | 112 | 315 | 287 | 261 | 366 | |
| 2007 | 555 | 388 | 353 | 526 | 516 | 819 | 992 | 826 | 558 | 631 | 421 | 753 |
| 2008 | 805 | 299 | 236 | 274 | 313 | 560 | 809 | 1,005 | 759 | 581 | 417 | 602 |
| 2009 | 696 | 827 | 748 | 558 | 723 | 995 | 974 | 1,199 | 1,386 | 1,138 | 1,427 | 1,329 |
| 2010 | 1,231 | 951 | 748 | 777 | 820 | 1,069 | 1,246 | 1,288 | 1,038 | 1,355 | 1,279 | 1,060 |
| 2011 | 1,226 | 1,105 | 784 | 801 | 947 | 679 | 626 | 865 | 896 | 658 | 930 | 1,137 |
| 2012 | 1,226 | 885 | 650 | 776 | 671 | 663 | 535 | 688 | 353 | 320 | 291 | 716 |
| 2013 | 958 | 696 | 917 | 776 | 377 | 984 | 1,007 | 1,023 | 942 | 403 | 474 | 954 |
| 2014 | 695 | 345 | 509 | 495 | 627 | 859 | 1,590 | 1,935 | 1,946 | 1,892 | 1,527 | 1,112 |
| 2015 | 770 | 469 | 271 | 595 | 756 | 1,087 | 1,689 | 1,994 | 2,356 | 2,431 | 2,622 | 2,540 |
| 2016 | 2,500 | 1,938 | 1,640 | 2,121 | 2,583 | 2,639 | 3,237 | 3,370 | 3,760 | 3,758 | 3,989 | 3,938 |
| 2017 | 3,689 | 3,633 | 3,426 | 3,510 | 3,741 | 3,694 | 4,021 | 3,717 | 3,199 | 2,967 | 3,441 | 3,212 |
| 2018 | 2,051 | 1,613 | 1,202 | 920 | 1,033 | 1,061 | 1,044 | 1,270 | 1,397 | 1,154 | 1,320 | 1,484 |
| 2019 | 1,345 | 1,097 | 747 | 637 | 999 | 1,647 | 1,975 | 2,180 | 1,585 | 1,463 | 1,309 | 2,063 |
| 2020 | 1,592 | 1,213 | 1,274 | 2,003 | 3,841 | 4,621 | 4,691 | 4,661 | 4,343 | 4,205 | 4,081 | 4,293 |
| 2021 | 4,035 | 3,788 | 3,006 | 2,198 | 1,416 | 1,215 | 1,011 | 1,385 | 1,202 | 939 | 1,303 | 1,981 |
| 2022 | 1,765 | 993 | 583 | 487 | 638 | 764 | 688 | 657 | 640 | 440 | 696 | 902 |
| 2023 | 811 | 995 | 723 | 736 | 639 | 637 | 807 | 555 | 479 | 350 | 479 | 779 |
| 2024 | 920 | |||||||||||
| - = No Data Reported; -- = Not Applicable; NA = Not Available; W = Withheld to avoid disclosure of individual company data. |
| Release Date: 3/29/2024 |
| Next Release Date: 4/30/2024 |