|
Download Data (XLS File) |
|
||||||||
|
||||||||
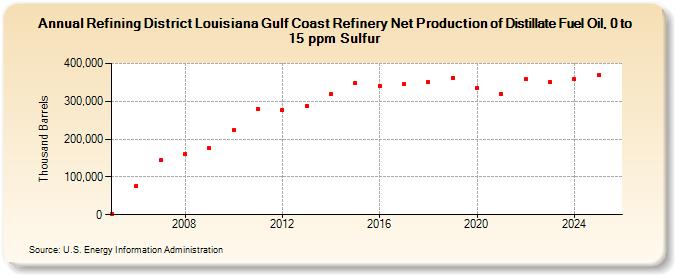
| Refining District Louisiana Gulf Coast Refinery Net Production of Distillate Fuel Oil, 0 to 15 ppm Sulfur (Thousand Barrels) | ||||||||
| Decade | Year-0 | Year-1 | Year-2 | Year-3 | Year-4 | Year-5 | Year-6 | Year-7 | Year-8 | Year-9 |
|---|---|---|---|---|---|---|---|---|---|---|
| 2000's | 1,397 | 76,654 | 144,006 | 160,031 | 175,139 | |||||
| 2010's | 224,115 | 280,011 | 276,353 | 288,318 | 318,403 | 348,736 | 340,234 | 344,542 | 350,648 | 362,805 |
| 2020's | 335,456 | 319,812 | 358,566 | 352,296 |
| - = No Data Reported; -- = Not Applicable; NA = Not Available; W = Withheld to avoid disclosure of individual company data. |
| Release Date: 8/30/2024 |
| Next Release Date: 8/29/2025 |