|
Download Data (XLS File) |
|
||||||||
|
||||||||
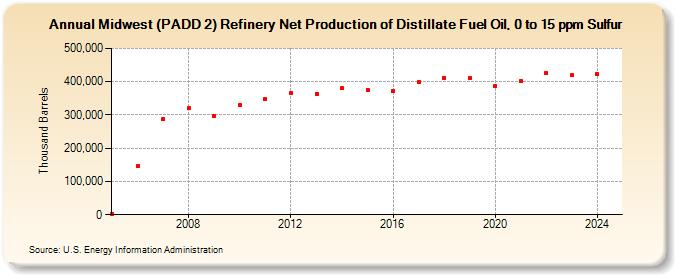
| Midwest (PADD 2) Refinery Net Production of Distillate Fuel Oil, 0 to 15 ppm Sulfur (Thousand Barrels) | ||||||||
| Decade | Year-0 | Year-1 | Year-2 | Year-3 | Year-4 | Year-5 | Year-6 | Year-7 | Year-8 | Year-9 |
|---|---|---|---|---|---|---|---|---|---|---|
| 2000's | 1,526 | 146,599 | 286,393 | 319,734 | 296,176 | |||||
| 2010's | 331,044 | 347,599 | 366,272 | 364,278 | 379,991 | 375,779 | 372,249 | 398,286 | 410,778 | 412,344 |
| 2020's | 388,085 | 401,346 | 425,679 | 418,534 |
| - = No Data Reported; -- = Not Applicable; NA = Not Available; W = Withheld to avoid disclosure of individual company data. |
| Release Date: 3/29/2024 |
| Next Release Date: 8/30/2024 |