|
Download Data (XLS File) |
|
||||||||
|
||||||||
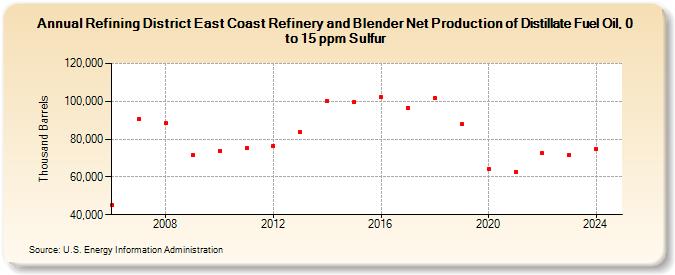
| Refining District East Coast Refinery and Blender Net Production of Distillate Fuel Oil, 0 to 15 ppm Sulfur (Thousand Barrels) | ||||||||
| Decade | Year-0 | Year-1 | Year-2 | Year-3 | Year-4 | Year-5 | Year-6 | Year-7 | Year-8 | Year-9 |
|---|---|---|---|---|---|---|---|---|---|---|
| 2000's | 45,000 | 90,800 | 88,360 | 71,386 | ||||||
| 2010's | 73,959 | 75,040 | 76,454 | 83,503 | 100,187 | 99,731 | 102,193 | 96,504 | 101,748 | 87,807 |
| 2020's | 64,371 | 62,462 | 72,394 | 71,823 |
| - = No Data Reported; -- = Not Applicable; NA = Not Available; W = Withheld to avoid disclosure of individual company data. |
| Release Date: 3/29/2024 |
| Next Release Date: 8/30/2024 |