|
Download Data (XLS File) |
|
||||||||
|
||||||||
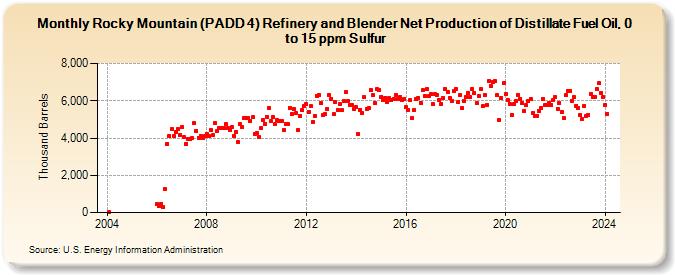
| Rocky Mountain (PADD 4) Refinery and Blender Net Production of Distillate Fuel Oil, 0 to 15 ppm Sulfur (Thousand Barrels) | ||||||||
| Year | Jan | Feb | Mar | Apr | May | Jun | Jul | Aug | Sep | Oct | Nov | Dec |
|---|---|---|---|---|---|---|---|---|---|---|---|---|
| 2004 | 9 | |||||||||||
| 2006 | 442 | 368 | 480 | 281 | 1,247 | 3,704 | 4,112 | 4,471 | 4,134 | 4,329 | 4,474 | 4,159 |
| 2007 | 4,601 | 4,031 | 3,696 | 3,958 | 3,943 | 3,994 | 4,785 | 4,381 | 4,022 | 4,134 | 4,000 | 4,089 |
| 2008 | 4,228 | 4,083 | 4,437 | 4,140 | 4,797 | 4,390 | 4,540 | 4,564 | 4,537 | 4,754 | 4,533 | 4,452 |
| 2009 | 4,591 | 4,120 | 4,328 | 3,790 | 4,763 | 4,575 | 5,060 | 5,089 | 5,063 | 4,914 | 5,102 | 4,240 |
| 2010 | 4,289 | 4,044 | 4,514 | 4,961 | 4,773 | 5,142 | 5,601 | 4,926 | 5,113 | 4,731 | 4,942 | 4,935 |
| 2011 | 4,890 | 4,445 | 4,746 | 4,727 | 5,604 | 5,289 | 5,531 | 5,354 | 4,438 | 5,207 | 5,489 | 5,736 |
| 2012 | 5,825 | 5,422 | 5,704 | 4,869 | 5,195 | 6,277 | 6,299 | 5,863 | 5,244 | 5,284 | 5,563 | 6,282 |
| 2013 | 6,112 | 5,272 | 5,935 | 5,478 | 5,835 | 5,495 | 5,966 | 6,446 | 5,963 | 5,778 | 5,759 | 5,583 |
| 2014 | 5,649 | 4,227 | 5,523 | 5,333 | 6,207 | 5,546 | 5,592 | 6,586 | 6,315 | 5,866 | 6,605 | 6,593 |
| 2015 | 6,222 | 6,067 | 6,168 | 5,929 | 6,121 | 6,019 | 6,087 | 6,313 | 6,082 | 6,206 | 6,041 | 6,086 |
| 2016 | 5,664 | 5,513 | 6,021 | 5,050 | 5,492 | 6,091 | 6,151 | 5,898 | 6,557 | 6,265 | 6,607 | 6,249 |
| 2017 | 6,341 | 5,823 | 6,352 | 6,313 | 6,034 | 5,847 | 6,150 | 6,607 | 6,475 | 6,155 | 6,006 | 6,531 |
| 2018 | 6,648 | 5,911 | 6,298 | 5,610 | 5,966 | 6,219 | 6,439 | 6,183 | 6,624 | 6,427 | 5,882 | 6,274 |
| 2019 | 6,606 | 5,708 | 6,282 | 5,766 | 7,067 | 6,784 | 7,023 | 7,047 | 6,307 | 4,993 | 6,150 | 6,934 |
| 2020 | 6,336 | 6,028 | 5,848 | 5,243 | 5,830 | 5,978 | 6,324 | 6,108 | 5,872 | 5,445 | 5,771 | 5,967 |
| 2021 | 6,082 | 5,347 | 5,202 | 5,158 | 5,461 | 5,597 | 6,106 | 5,746 | 5,789 | 5,896 | 5,763 | 6,023 |
| 2022 | 6,193 | 5,572 | 5,886 | 5,401 | 5,074 | 6,288 | 6,535 | 6,528 | 6,005 | 6,186 | 5,739 | 5,624 |
| 2023 | 5,212 | 5,012 | 5,721 | 5,189 | 5,262 | 6,357 | 6,180 | 6,178 | 6,643 | 6,937 | 6,442 | 6,207 |
| 2024 | 5,791 | 5,302 | 5,845 | 5,938 | ||||||||
| - = No Data Reported; -- = Not Applicable; NA = Not Available; W = Withheld to avoid disclosure of individual company data. |
| Release Date: 6/28/2024 |
| Next Release Date: 7/31/2024 |