|
Download Data (XLS File) |
|
||||||||
|
||||||||
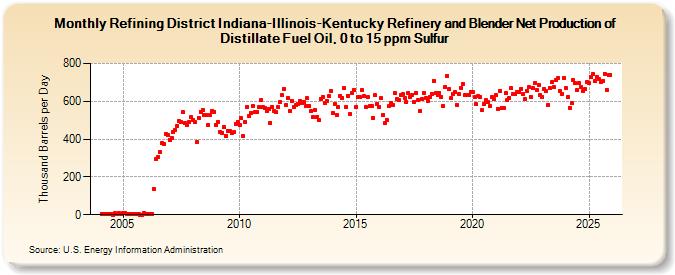
| Refining District Indiana-Illinois-Kentucky Refinery and Blender Net Production of Distillate Fuel Oil, 0 to 15 ppm Sulfur (Thousand Barrels per Day) | ||||||||
| Year | Jan | Feb | Mar | Apr | May | Jun | Jul | Aug | Sep | Oct | Nov | Dec |
|---|---|---|---|---|---|---|---|---|---|---|---|---|
| 2004 | 6 | 3 | 2 | 3 | 2 | 4 | 1 | 7 | 3 | 7 | 5 | |
| 2005 | 9 | 8 | 2 | 2 | 3 | 2 | 5 | 3 | 6 | 1 | 1 | 8 |
| 2006 | 6 | 3 | 6 | 6 | 137 | 293 | 303 | 332 | 378 | 376 | 428 | 421 |
| 2007 | 397 | 406 | 435 | 449 | 470 | 496 | 491 | 541 | 485 | 473 | 488 | 515 |
| 2008 | 503 | 489 | 383 | 512 | 545 | 554 | 525 | 525 | 476 | 529 | 550 | 544 |
| 2009 | 476 | 491 | 440 | 434 | 463 | 419 | 445 | 441 | 430 | 437 | 482 | 491 |
| 2010 | 475 | 510 | 415 | 490 | 571 | 523 | 540 | 574 | 541 | 545 | 569 | 605 |
| 2011 | 570 | 563 | 551 | 560 | 487 | 571 | 551 | 542 | 571 | 594 | 633 | 667 |
| 2012 | 583 | 617 | 550 | 601 | 570 | 582 | 585 | 600 | 591 | 595 | 575 | 615 |
| 2013 | 574 | 547 | 516 | 555 | 517 | 499 | 613 | 624 | 591 | 603 | 626 | 657 |
| 2014 | 539 | 586 | 530 | 569 | 629 | 618 | 669 | 572 | 630 | 534 | 643 | 662 |
| 2015 | 571 | 624 | 621 | 661 | 626 | 569 | 622 | 575 | 577 | 512 | 631 | 586 |
| 2016 | 572 | 616 | 529 | 483 | 500 | 574 | 593 | 580 | 644 | 613 | 606 | 633 |
| 2017 | 636 | 619 | 595 | 646 | 622 | 632 | 598 | 645 | 607 | 546 | 610 | 645 |
| 2018 | 618 | 602 | 624 | 639 | 709 | 642 | 632 | 643 | 625 | 574 | 676 | 735 |
| 2019 | 665 | 617 | 639 | 649 | 582 | 639 | 672 | 692 | 634 | 634 | 635 | 651 |
| 2020 | 649 | 621 | 584 | 629 | 623 | 553 | 586 | 606 | 594 | 576 | 622 | 612 |
| 2021 | 631 | 561 | 652 | 564 | 564 | 642 | 609 | 620 | 670 | 641 | 638 | 649 |
| 2022 | 648 | 667 | 638 | 612 | 657 | 674 | 625 | 669 | 695 | 660 | 684 | 632 |
| 2023 | 624 | 664 | 652 | 583 | 670 | 700 | 674 | 711 | 723 | 656 | 637 | 722 |
| 2024 | 670 | |||||||||||
| - = No Data Reported; -- = Not Applicable; NA = Not Available; W = Withheld to avoid disclosure of individual company data. |
| Release Date: 3/29/2024 |
| Next Release Date: 4/30/2024 |