|
Download Data (XLS File) |
|
||||||||
|
||||||||
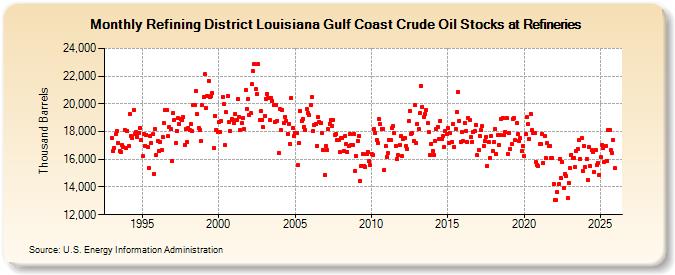
| Refining District Louisiana Gulf Coast Crude Oil Stocks at Refineries (Thousand Barrels) | ||||||||
| Year | Jan | Feb | Mar | Apr | May | Jun | Jul | Aug | Sep | Oct | Nov | Dec |
|---|---|---|---|---|---|---|---|---|---|---|---|---|
| 1993 | 17,552 | 16,574 | 16,802 | 17,811 | 18,048 | 17,207 | 16,619 | 16,534 | 17,029 | 16,854 | 18,144 | 16,833 |
| 1994 | 18,030 | 16,937 | 19,254 | 17,672 | 17,553 | 19,561 | 17,825 | 17,964 | 17,618 | 17,922 | 18,264 | 17,402 |
| 1995 | 16,229 | 17,816 | 16,990 | 17,755 | 16,909 | 15,368 | 17,707 | 17,183 | 17,798 | 14,966 | 18,176 | 16,313 |
| 1996 | 17,334 | 16,599 | 17,257 | 16,661 | 17,581 | 18,584 | 19,547 | 19,576 | 17,646 | 18,346 | 18,173 | 15,902 |
| 1997 | 19,305 | 18,858 | 17,153 | 18,053 | 18,943 | 18,555 | 18,871 | 18,813 | 19,044 | 17,058 | 18,158 | 17,250 |
| 1998 | 18,253 | 18,077 | 18,535 | 18,029 | 19,886 | 19,936 | 20,927 | 19,231 | 18,272 | 18,095 | 17,287 | 19,908 |
| 1999 | 20,482 | 22,131 | 19,703 | 20,566 | 21,670 | 20,464 | 20,558 | 20,799 | 16,799 | 19,110 | 18,140 | 17,998 |
| 2000 | 18,679 | 17,976 | 18,779 | 20,514 | 19,999 | 17,000 | 19,385 | 20,575 | 18,711 | 18,035 | 18,913 | 18,830 |
| 2001 | 18,597 | 19,275 | 18,849 | 20,336 | 19,063 | 18,100 | 18,581 | 18,997 | 18,167 | 20,996 | 19,644 | 20,336 |
| 2002 | 19,185 | 19,310 | 21,406 | 22,344 | 22,890 | 21,042 | 20,705 | 22,861 | 18,845 | 19,447 | 18,850 | 18,297 |
| 2003 | 19,151 | 20,383 | 20,705 | 20,416 | 18,821 | 20,409 | 20,223 | 19,881 | 18,688 | 19,940 | 18,788 | 16,463 |
| 2004 | 19,612 | 18,097 | 19,570 | 18,617 | 19,063 | 18,793 | 17,831 | 18,570 | 17,102 | 20,450 | 18,283 | 17,674 |
| 2005 | 17,903 | 17,912 | 15,562 | 17,186 | 19,474 | 18,771 | 18,929 | 18,347 | 18,118 | 19,654 | 19,330 | 19,162 |
| 2006 | 19,930 | 20,498 | 18,031 | 18,466 | 18,578 | 16,982 | 19,015 | 18,710 | 18,585 | 17,870 | 16,692 | 14,876 |
| 2007 | 16,980 | 16,675 | 18,155 | 18,564 | 18,807 | 18,426 | 18,851 | 17,779 | 17,819 | 17,396 | 17,357 | 16,503 |
| 2008 | 17,556 | 17,570 | 16,627 | 17,666 | 17,100 | 16,529 | 16,969 | 17,801 | 17,049 | 17,061 | 17,842 | 15,174 |
| 2009 | 16,236 | 17,339 | 17,711 | 14,438 | 15,542 | 16,374 | 15,526 | 15,465 | 16,371 | 16,548 | 15,883 | 15,581 |
| 2010 | 16,416 | 16,315 | 18,172 | 17,903 | 17,388 | 17,148 | 18,886 | 18,517 | 18,152 | 18,189 | 15,258 | 16,974 |
| 2011 | 16,143 | 16,428 | 17,420 | 17,373 | 18,226 | 18,396 | 17,880 | 16,989 | 16,036 | 16,283 | 17,016 | 17,676 |
| 2012 | 16,227 | 17,462 | 17,541 | 16,961 | 16,742 | 18,761 | 19,497 | 17,837 | 17,913 | 17,309 | 19,893 | 17,146 |
| 2013 | 18,557 | 18,178 | 19,318 | 21,277 | 19,757 | 19,060 | 19,270 | 19,541 | 18,603 | 17,936 | 16,339 | 17,129 |
| 2014 | 16,620 | 16,307 | 17,342 | 18,212 | 18,348 | 17,449 | 18,791 | 17,470 | 17,694 | 16,911 | 18,037 | 17,816 |
| 2015 | 18,291 | 17,175 | 17,893 | 17,232 | 18,548 | 16,884 | 18,182 | 19,403 | 20,870 | 18,790 | 17,269 | 17,993 |
| 2016 | 17,307 | 18,652 | 18,004 | 17,272 | 18,968 | 18,818 | 17,624 | 17,281 | 17,949 | 18,069 | 18,496 | 16,284 |
| 2017 | 16,652 | 17,681 | 18,082 | 18,370 | 16,971 | 17,322 | 17,634 | 15,533 | 17,239 | 16,123 | 17,694 | 16,616 |
| 2018 | 17,281 | 18,177 | 16,393 | 17,737 | 17,014 | 17,782 | 18,924 | 18,964 | 17,743 | 17,955 | 18,987 | 16,358 |
| 2019 | 17,917 | 16,767 | 17,100 | 18,906 | 18,992 | 17,371 | 18,628 | 17,810 | 17,348 | 17,504 | 16,585 | 16,965 |
| 2020 | 16,214 | 17,793 | 19,016 | 18,511 | 17,490 | 19,299 | 18,098 | 17,927 | 17,874 | 15,803 | 15,612 | 15,491 |
| 2021 | 17,081 | 17,077 | 17,859 | 15,726 | 17,692 | 16,059 | 17,156 | 16,976 | 16,989 | 16,113 | 16,105 | 14,221 |
| 2022 | 13,076 | 13,043 | 13,609 | 14,188 | 16,044 | 14,644 | 15,789 | 13,916 | 14,966 | 14,797 | 13,173 | 14,311 |
| 2023 | 15,341 | 16,298 | 16,075 | 16,126 | 15,408 | 16,502 | 16,367 | 17,356 | 16,014 | 17,529 | 15,181 | 16,983 |
| 2024 | 15,447 | |||||||||||
| - = No Data Reported; -- = Not Applicable; NA = Not Available; W = Withheld to avoid disclosure of individual company data. |
| Release Date: 3/29/2024 |
| Next Release Date: 4/30/2024 |
Referring Pages: