|
Download Data (XLS File) |
|
||||||||
|
||||||||
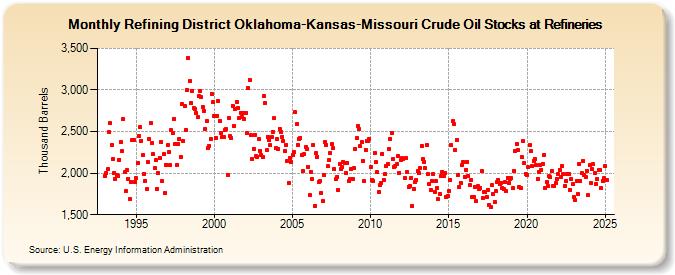
| Refining District Oklahoma-Kansas-Missouri Crude Oil Stocks at Refineries (Thousand Barrels) | ||||||||
| Year | Jan | Feb | Mar | Apr | May | Jun | Jul | Aug | Sep | Oct | Nov | Dec |
|---|---|---|---|---|---|---|---|---|---|---|---|---|
| 1993 | 1,968 | 2,002 | 2,046 | 2,494 | 2,602 | 2,341 | 2,167 | 2,004 | 1,933 | 1,977 | 1,969 | 2,162 |
| 1994 | 2,374 | 2,262 | 2,647 | 2,008 | 1,782 | 2,037 | 1,930 | 1,687 | 1,897 | 2,403 | 2,404 | 1,898 |
| 1995 | 1,937 | 2,117 | 2,444 | 2,551 | 2,391 | 2,224 | 1,991 | 1,906 | 1,810 | 2,129 | 2,412 | 2,605 |
| 1996 | 2,368 | 2,227 | 2,061 | 2,157 | 1,813 | 2,001 | 2,185 | 2,380 | 1,905 | 2,225 | 1,762 | 2,101 |
| 1997 | 2,335 | 2,252 | 2,095 | 2,515 | 2,479 | 2,654 | 2,351 | 2,102 | 2,345 | 2,416 | 2,196 | 2,826 |
| 1998 | 2,386 | 2,810 | 2,520 | 3,000 | 3,390 | 3,109 | 2,839 | 2,993 | 2,788 | 2,774 | 2,719 | 2,672 |
| 1999 | 2,924 | 2,993 | 2,912 | 2,801 | 2,749 | 2,532 | 2,624 | 2,297 | 2,331 | 2,410 | 2,953 | 2,855 |
| 2000 | 2,690 | 2,426 | 2,691 | 2,870 | 2,628 | 2,488 | 2,437 | 2,438 | 2,519 | 2,528 | 1,980 | 2,657 |
| 2001 | 2,444 | 2,421 | 2,812 | 2,567 | 2,771 | 2,861 | 2,787 | 2,658 | 2,729 | 2,676 | 2,720 | 2,647 |
| 2002 | 2,727 | 2,481 | 3,018 | 3,124 | 2,457 | 2,167 | 2,295 | 2,464 | 2,210 | 2,195 | 2,410 | 2,270 |
| 2003 | 2,224 | 2,191 | 2,922 | 2,838 | 2,273 | 2,440 | 2,403 | 2,333 | 2,429 | 2,499 | 2,659 | 2,299 |
| 2004 | 2,408 | 2,290 | 2,536 | 2,498 | 2,438 | 2,390 | 2,265 | 2,342 | 2,149 | 1,885 | 2,181 | 2,132 |
| 2005 | 2,223 | 2,249 | 2,730 | 2,585 | 2,339 | 2,411 | 2,423 | 2,220 | 2,023 | 2,227 | 2,316 | 2,293 |
| 2006 | 2,078 | 1,735 | 2,018 | 1,928 | 2,336 | 1,605 | 2,238 | 2,200 | 1,890 | 1,904 | 1,763 | 1,666 |
| 2007 | 1,982 | 2,378 | 2,340 | 2,083 | 2,155 | 2,245 | 2,348 | 2,299 | 2,049 | 1,928 | 1,958 | 1,798 |
| 2008 | 2,115 | 2,048 | 2,073 | 2,134 | 2,123 | 1,996 | 2,126 | 1,908 | 1,926 | 2,049 | 1,935 | 2,056 |
| 2009 | 2,296 | 2,421 | 2,568 | 2,533 | 2,325 | 2,377 | 2,149 | 1,901 | 2,279 | 2,391 | 2,384 | 2,409 |
| 2010 | 2,079 | 1,918 | 1,903 | 2,246 | 2,130 | 2,008 | 1,776 | 1,855 | 1,881 | 2,235 | 1,915 | 1,988 |
| 2011 | 2,084 | 2,108 | 2,291 | 2,413 | 2,485 | 2,170 | 2,078 | 2,086 | 2,106 | 2,203 | 2,006 | 2,159 |
| 2012 | 2,176 | 2,166 | 1,944 | 2,182 | 2,013 | 1,837 | 1,851 | 1,946 | 1,608 | 1,814 | 1,896 | 1,917 |
| 2013 | 2,025 | 1,996 | 2,066 | 2,332 | 2,167 | 2,139 | 2,060 | 2,334 | 1,985 | 1,866 | 1,794 | 1,909 |
| 2014 | 1,988 | 1,779 | 1,904 | 1,824 | 1,687 | 1,751 | 1,961 | 2,017 | 1,971 | 2,000 | 1,719 | 1,726 |
| 2015 | 1,788 | 1,915 | 2,337 | 2,626 | 2,590 | 2,284 | 2,404 | 1,980 | 1,834 | 1,882 | 2,092 | 2,134 |
| 2016 | 1,958 | 2,042 | 2,139 | 1,966 | 1,853 | 1,915 | 1,707 | 1,711 | 1,838 | 1,661 | 1,841 | 1,811 |
| 2017 | 1,827 | 2,024 | 1,706 | 1,778 | 1,776 | 1,714 | 1,802 | 1,616 | 1,587 | 1,853 | 1,755 | 1,658 |
| 2018 | 1,780 | 1,899 | 1,922 | 1,865 | 1,887 | 1,823 | 1,809 | 1,893 | 1,784 | 1,946 | 1,885 | 1,935 |
| 2019 | 1,936 | 1,816 | 2,031 | 2,264 | 2,354 | 2,277 | 1,834 | 1,818 | 2,192 | 2,381 | 2,125 | 1,995 |
| 2020 | 1,977 | 2,068 | 2,338 | 2,266 | 2,084 | 2,150 | 2,168 | 2,093 | 1,935 | 2,017 | 2,101 | 2,041 |
| 2021 | 2,113 | 2,221 | 1,817 | 1,894 | 1,850 | 1,965 | 1,949 | 2,025 | 1,848 | 1,851 | 1,879 | 1,935 |
| 2022 | 1,986 | 2,043 | 1,948 | 2,085 | 1,992 | 1,849 | 1,905 | 1,993 | 1,992 | 1,798 | 1,926 | 1,865 |
| 2023 | 1,717 | 1,678 | 1,906 | 1,750 | 2,110 | 1,903 | 1,996 | 2,151 | 1,983 | 1,953 | 2,031 | 1,734 |
| 2024 | 2,093 | |||||||||||
| - = No Data Reported; -- = Not Applicable; NA = Not Available; W = Withheld to avoid disclosure of individual company data. |
| Release Date: 3/29/2024 |
| Next Release Date: 4/30/2024 |