|
Download Data (XLS File) |
|
||||||||
|
||||||||
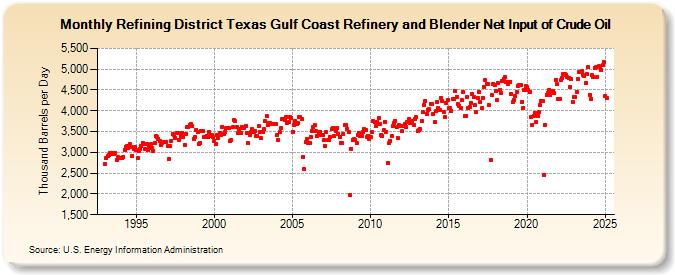
| Refining District Texas Gulf Coast Refinery and Blender Net Input of Crude Oil (Thousand Barrels per Day) | ||||||||
| Year | Jan | Feb | Mar | Apr | May | Jun | Jul | Aug | Sep | Oct | Nov | Dec |
|---|---|---|---|---|---|---|---|---|---|---|---|---|
| 1993 | 2,718 | 2,861 | 2,901 | 2,937 | 2,987 | 2,964 | 2,989 | 2,959 | 2,992 | 2,811 | 2,883 | 2,864 |
| 1994 | 2,854 | 2,859 | 2,880 | 3,063 | 3,129 | 3,151 | 3,108 | 3,198 | 3,129 | 2,919 | 3,086 | 3,121 |
| 1995 | 3,054 | 2,860 | 3,041 | 3,085 | 3,161 | 3,232 | 3,198 | 3,078 | 3,200 | 3,056 | 3,134 | 3,193 |
| 1996 | 3,099 | 3,038 | 3,222 | 3,383 | 3,372 | 3,331 | 3,263 | 3,184 | 3,236 | 3,250 | 3,258 | 3,252 |
| 1997 | 3,143 | 2,836 | 3,148 | 3,262 | 3,440 | 3,412 | 3,355 | 3,471 | 3,457 | 3,306 | 3,393 | 3,468 |
| 1998 | 3,373 | 3,182 | 3,433 | 3,600 | 3,605 | 3,646 | 3,675 | 3,623 | 3,318 | 3,371 | 3,541 | 3,492 |
| 1999 | 3,212 | 3,227 | 3,502 | 3,504 | 3,367 | 3,371 | 3,395 | 3,362 | 3,479 | 3,398 | 3,413 | 3,363 |
| 2000 | 3,280 | 3,199 | 3,419 | 3,349 | 3,470 | 3,422 | 3,616 | 3,447 | 3,496 | 3,589 | 3,578 | 3,576 |
| 2001 | 3,262 | 3,294 | 3,599 | 3,781 | 3,747 | 3,607 | 3,464 | 3,559 | 3,455 | 3,614 | 3,593 | 3,595 |
| 2002 | 3,636 | 3,472 | 3,214 | 3,408 | 3,482 | 3,566 | 3,496 | 3,516 | 3,397 | 3,390 | 3,627 | 3,497 |
| 2003 | 3,340 | 3,500 | 3,556 | 3,755 | 3,874 | 3,656 | 3,711 | 3,704 | 3,677 | 3,675 | 3,684 | 3,679 |
| 2004 | 3,413 | 3,307 | 3,481 | 3,589 | 3,805 | 3,803 | 3,789 | 3,857 | 3,717 | 3,731 | 3,859 | 3,821 |
| 2005 | 3,497 | 3,655 | 3,749 | 3,670 | 3,715 | 3,858 | 3,848 | 3,811 | 2,883 | 2,598 | 3,253 | 3,332 |
| 2006 | 3,226 | 3,225 | 3,375 | 3,522 | 3,607 | 3,656 | 3,510 | 3,399 | 3,477 | 3,494 | 3,425 | 3,411 |
| 2007 | 3,294 | 3,151 | 3,484 | 3,292 | 3,295 | 3,370 | 3,550 | 3,593 | 3,392 | 3,519 | 3,586 | 3,448 |
| 2008 | 3,376 | 3,231 | 3,231 | 3,443 | 3,647 | 3,651 | 3,565 | 3,487 | 1,963 | 3,090 | 3,294 | 3,313 |
| 2009 | 3,308 | 3,230 | 3,419 | 3,466 | 3,397 | 3,397 | 3,491 | 3,567 | 3,527 | 3,364 | 3,390 | 3,320 |
| 2010 | 3,363 | 3,480 | 3,755 | 3,723 | 3,637 | 3,730 | 3,816 | 3,691 | 3,419 | 3,401 | 3,539 | 3,736 |
| 2011 | 3,497 | 2,750 | 3,218 | 3,284 | 3,385 | 3,633 | 3,698 | 3,764 | 3,599 | 3,336 | 3,657 | 3,636 |
| 2012 | 3,507 | 3,626 | 3,687 | 3,615 | 3,729 | 3,795 | 3,708 | 3,754 | 3,763 | 3,656 | 3,798 | 3,842 |
| 2013 | 3,524 | 3,538 | 3,558 | 3,744 | 3,968 | 4,146 | 4,223 | 3,929 | 4,026 | 4,038 | 4,171 | 4,157 |
| 2014 | 3,913 | 3,724 | 3,987 | 4,217 | 4,067 | 4,009 | 4,306 | 4,240 | 3,975 | 3,849 | 4,182 | 4,259 |
| 2015 | 4,066 | 4,075 | 3,995 | 4,285 | 4,274 | 4,470 | 4,341 | 4,165 | 4,121 | 4,055 | 4,258 | 4,443 |
| 2016 | 3,866 | 3,869 | 4,326 | 4,062 | 4,091 | 4,192 | 4,402 | 4,341 | 4,128 | 3,972 | 4,298 | 4,462 |
| 2017 | 4,204 | 4,059 | 4,315 | 4,579 | 4,737 | 4,641 | 4,641 | 4,128 | 2,825 | 4,376 | 4,654 | 4,619 |
| 2018 | 4,465 | 4,263 | 4,666 | 4,504 | 4,435 | 4,717 | 4,763 | 4,803 | 4,682 | 4,643 | 4,698 | 4,701 |
| 2019 | 4,405 | 4,205 | 4,265 | 4,354 | 4,460 | 4,603 | 4,609 | 4,621 | 4,199 | 4,062 | 4,496 | 4,585 |
| 2020 | 4,566 | 4,500 | 4,445 | 3,838 | 3,653 | 3,866 | 3,954 | 3,741 | 3,883 | 3,978 | 4,129 | 4,241 |
| 2021 | 4,225 | 2,465 | 3,666 | 4,380 | 4,437 | 4,509 | 4,379 | 4,483 | 4,479 | 4,421 | 4,751 | 4,632 |
| 2022 | 4,290 | 4,291 | 4,743 | 4,785 | 4,884 | 4,896 | 4,862 | 4,804 | 4,792 | 4,569 | 4,768 | 4,205 |
| 2023 | 4,328 | 4,319 | 4,458 | 4,763 | 4,930 | 4,936 | 4,952 | 4,872 | 4,825 | 4,668 | 4,878 | 5,046 |
| 2024 | 4,390 | |||||||||||
| - = No Data Reported; -- = Not Applicable; NA = Not Available; W = Withheld to avoid disclosure of individual company data. |
| Release Date: 3/29/2024 |
| Next Release Date: 4/30/2024 |