|
Download Data (XLS File) |
|
||||||||
|
||||||||
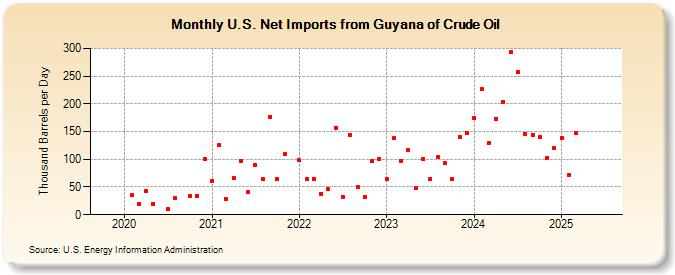
| U.S. Net Imports from Guyana of Crude Oil (Thousand Barrels per Day) | ||||||||
| Year | Jan | Feb | Mar | Apr | May | Jun | Jul | Aug | Sep | Oct | Nov | Dec |
|---|---|---|---|---|---|---|---|---|---|---|---|---|
| 2020 | 35 | 20 | 43 | 20 | 10 | 31 | 34 | 33 | 100 | |||
| 2021 | 60 | 125 | 28 | 67 | 97 | 41 | 89 | 64 | 176 | 64 | 109 | |
| 2022 | 98 | 65 | 65 | 38 | 46 | 157 | 32 | 144 | 50 | 32 | 97 | 100 |
| 2023 | 64 | 139 | 97 | 116 | 49 | 100 | 65 | 104 | 94 | 65 | 141 | 147 |
| 2024 | 175 | 227 | 129 | 173 | 204 | 293 | 258 | 145 | 144 | 141 | 103 | 121 |
| 2025 | 139 | 71 | 148 | 348 | ||||||||
| - = No Data Reported; -- = Not Applicable; NA = Not Available; W = Withheld to avoid disclosure of individual company data. |
| Release Date: 6/30/2025 |
| Next Release Date: 7/31/2025 |