|
Download Data (XLS File) |
|
||||||||
|
||||||||
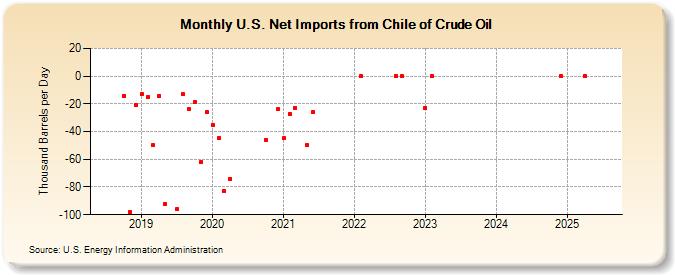
| U.S. Net Imports from Chile of Crude Oil (Thousand Barrels per Day) | ||||||||
| Year | Jan | Feb | Mar | Apr | May | Jun | Jul | Aug | Sep | Oct | Nov | Dec |
|---|---|---|---|---|---|---|---|---|---|---|---|---|
| 2018 | -14 | -98 | -21 | |||||||||
| 2019 | -13 | -15 | -50 | -14 | -92 | -96 | -13 | -24 | -19 | -62 | -26 | |
| 2020 | -35 | -45 | -83 | -74 | -46 | -24 | ||||||
| 2021 | -45 | -27 | -23 | -50 | -26 | |||||||
| 2022 | 0 | 0 | 0 | |||||||||
| 2023 | -23 | -26 | ||||||||||
| - = No Data Reported; -- = Not Applicable; NA = Not Available; W = Withheld to avoid disclosure of individual company data. |
| Release Date: 3/29/2024 |
| Next Release Date: 4/30/2024 |