|
Download Data (XLS File) |
|
||||||||
|
||||||||
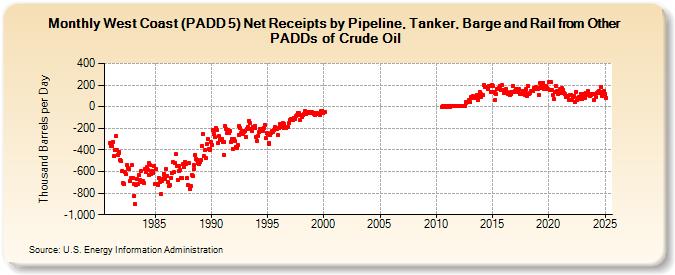
| West Coast (PADD 5) Net Receipts by Pipeline, Tanker, Barge and Rail from Other PADDs of Crude Oil (Thousand Barrels per Day) | ||||||||
| Year | Jan | Feb | Mar | Apr | May | Jun | Jul | Aug | Sep | Oct | Nov | Dec |
|---|---|---|---|---|---|---|---|---|---|---|---|---|
| 1981 | -334 | -368 | -363 | -323 | -460 | -398 | -275 | -402 | -443 | -426 | -417 | -491 |
| 1982 | -502 | -592 | -708 | -713 | -603 | -626 | -541 | -567 | -573 | -691 | -663 | -543 |
| 1983 | -659 | -714 | -825 | -905 | -728 | -671 | -716 | -634 | -679 | -595 | -699 | -689 |
| 1984 | -706 | -578 | -608 | -561 | -586 | -523 | -629 | -542 | -625 | -591 | -610 | -549 |
| 1985 | -715 | -579 | -720 | -721 | -660 | -693 | -810 | -684 | -665 | -619 | -660 | -674 |
| 1986 | -577 | -642 | -697 | -738 | -729 | -659 | -612 | -513 | -607 | -519 | -440 | -552 |
| 1987 | -675 | -551 | -593 | -589 | -663 | -662 | -534 | -560 | -509 | -530 | -661 | -725 |
| 1988 | -524 | -758 | -736 | -630 | -641 | -580 | -543 | -448 | -481 | -491 | -518 | -534 |
| 1989 | -515 | -493 | -366 | -255 | -461 | -404 | -473 | -347 | -303 | -394 | -399 | -392 |
| 1990 | -330 | -356 | -219 | -256 | -284 | -194 | -217 | -340 | -270 | -303 | -312 | -296 |
| 1991 | -323 | -443 | -330 | -182 | -202 | -241 | -219 | -248 | -224 | -325 | -296 | -392 |
| 1992 | -297 | -316 | -373 | -385 | -356 | -258 | -178 | -201 | -248 | -225 | -252 | -230 |
| 1993 | -225 | -276 | -203 | -184 | -130 | -153 | -207 | -227 | -188 | -191 | -180 | -200 |
| 1994 | -283 | -316 | -267 | -232 | -203 | -204 | -214 | -227 | -198 | -169 | -293 | -246 |
| 1995 | -255 | -344 | -336 | -265 | -244 | -228 | -232 | -220 | -191 | -193 | -208 | -259 |
| 1996 | -196 | -163 | -186 | -166 | -155 | -198 | -158 | -184 | -194 | -187 | -190 | -154 |
| 1997 | -119 | -116 | -112 | -123 | -102 | -114 | -90 | -80 | -56 | -62 | -73 | -124 |
| 1998 | -73 | -97 | -81 | -64 | -41 | -65 | -56 | -45 | -47 | -63 | -52 | -51 |
| 1999 | -56 | -63 | -64 | -79 | -54 | -62 | -65 | -68 | -78 | -44 | -42 | -62 |
| 2000 | -49 | -49 | ||||||||||
| 2010 | 1 | 5 | 1 | 6 | 3 | 1 | ||||||
| 2011 | 4 | 1 | 5 | 2 | 6 | 3 | 5 | 4 | 2 | 4 | 9 | |
| 2012 | 3 | 7 | 3 | 6 | 8 | 7 | 11 | 34 | 44 | 43 | 44 | 66 |
| 2013 | 40 | 87 | 79 | 98 | 83 | 79 | 76 | 105 | 65 | 91 | 137 | 119 |
| 2014 | 93 | 108 | 107 | 199 | 179 | 182 | 185 | 164 | 193 | 194 | 139 | 200 |
| 2015 | 195 | 139 | 127 | 66 | 120 | 163 | 165 | 171 | 194 | 152 | 197 | 156 |
| 2016 | 128 | 129 | 163 | 136 | 122 | 117 | 107 | 133 | 117 | 137 | 192 | 139 |
| 2017 | 148 | 165 | 144 | 136 | 160 | 116 | 113 | 127 | 148 | 139 | 112 | 124 |
| 2018 | 161 | 101 | 190 | 115 | 131 | 148 | 141 | 145 | 177 | 163 | 182 | 174 |
| 2019 | 161 | 111 | 175 | 219 | 203 | 187 | 222 | 166 | 164 | 193 | 175 | 162 |
| 2020 | 231 | 154 | 227 | 153 | 108 | 68 | 135 | 193 | 135 | 146 | 116 | 147 |
| 2021 | 164 | 124 | 175 | 158 | 127 | 114 | 92 | 90 | 103 | 61 | 105 | 106 |
| 2022 | 59 | 61 | 92 | 103 | 47 | 137 | 66 | 76 | 94 | 70 | 119 | 72 |
| 2023 | 104 | 116 | 80 | 126 | 112 | 131 | 141 | 116 | 97 | 111 | 119 | 119 |
| 2024 | 62 | |||||||||||
| - = No Data Reported; -- = Not Applicable; NA = Not Available; W = Withheld to avoid disclosure of individual company data. |
| Release Date: 3/29/2024 |
| Next Release Date: 4/30/2024 |